



Notes to the condensed group interim financial statements
1. Corporate background
Exxaro, a public company incorporated in South Africa, is a diversified resources group with interests in the coal, energy and metals markets. These reviewed condensed group interim financial statements as at and for the six-month period ended 30 June 2026 (condensed group interim financial statements) comprise the company and its subsidiaries (together referred to as the group) and the group’s interests in associates and joint ventures.
2. Basis of preparation
2.1 Statement of compliance
The condensed group interim financial statements have been prepared in accordance with, and containing the information required by, IAS 34 Interim Financial Reporting, the Financial Pronouncements (as issued by the Financial Reporting Standards Council), the SAICA Financial Reporting Guides (as issued by the Accounting Practices Committee), the JSE Listings Requirements, and the South African Companies Act.
The condensed group interim financial statements have been prepared under the supervision of Mr PA Koppeschaar CA(SA), SAICA registration number: 00038621.
The condensed group interim financial statements should be read in conjunction with the group and company annual financial statements as at and for the year ended 31 December 2025, which have been prepared in accordance with IFRS Accounting Standards. The condensed group interim financial statements have been prepared on the historical cost basis, except for financial instruments, share-based payments and biological assets, which are measured at fair value.
The condensed group interim financial statements were authorised for issue by the board of directors on 18 August 2026.
2.2 Judgements and estimates
Management made judgements and applied estimates and assumptions that affect the application of accounting policies and the reported amounts of assets, liabilities, income and expenses. Actual results may differ from these estimates. The significant judgements and the key sources of estimation uncertainty were similar to those applied to the group and company annual financial statements as at and for the year ended 31 December 2025.
3. Accounting policies
The accounting policies applied are in terms of IFRS Accounting Standards and are consistent with those of the previous financial year. The policy for recognising and measuring income taxes in the interim reporting period is consistent with that applied in the previous interim reporting period as described in 3.1 below. A number of new or amended IFRS Accounting Standards became effective for the current reporting period. The group did not have to make any significant changes to its accounting policies nor make retrospective adjustments as a result of adopting these new standards.
3.1 Income tax
Income tax expense is recognised based on management's estimate of the weighted average effective annual tax rate expected for the full financial year. The estimated weighted average effective annual tax rate for the six-month period ended 30 June 2026 is 22.39%, compared to 19.98% for the six-month period ended 30 June 2025.
The main reconciling items, between the current standard tax rate of 27% and the effective tax rate, results from the share of income of equity-accounted investment and dividend income (-6.8%) (30 June 2025: -9.1%).
3.2 Impact of new, amended or revised IFRS Accounting Standards issued but not yet effective
New IFRS Accounting Standards, amendments to IFRS Accounting Standards and interpretations issued, that are relevant to the group, but not yet effective on 30 June 2026, have not been early adopted. The group continuously evaluates the impact of these standards and amendments.
4. Reconciliation of group headline earnings
|
6 months 30 June 2026 Reviewed |
6 months 30 June 2025 Reviewed |
12 months 31 December 2025 Audited |
|||
|---|---|---|---|---|---|
|
Headline earnings per share |
|||||
|
Basic1 |
1 377 |
1 724 |
3 247 |
||
|
Diluted2 |
1 377 |
1 724 |
3 247 |
||
1 Determined using WANOS (millions of shares): |
234 |
241 |
238 |
||
2 Determined using diluted WANOS (millions of shares): |
234 |
241 |
238 |
|
Gross Rm |
Tax Rm |
NCI Rm |
Net Rm |
|||
|---|---|---|---|---|---|---|
|
6 months ended 30 June 2026 (Reviewed) |
||||||
|
Profit attributable to owners of the parent |
3 264 |
|||||
|
Adjusted for: |
(42) |
(12) |
13 |
(41) |
||
|
– IAS 16 Net losses on disposal of property, plant and equipment |
12 |
(3) |
(2) |
7 |
||
|
– IAS 21 Net gains on translation differences recycled to profit or loss on liquidation of foreign associate |
(92) |
22 |
(70) |
|||
|
– IAS 28 Gain on liquidation of investment in foreign associate |
(2) |
1 |
(1) |
|||
|
– IAS 28 Loss on dilution of investment in associate |
6 |
(1) |
5 |
|||
|
– IAS 28 Share of equity-accounted investments’ separately identifiable remeasurements |
34 |
(9) |
(7) |
18 |
||
|
Headline earnings |
3 223 |
|||||
|
Gross Rm |
Tax Rm |
NCI Rm |
Net Rm |
|||
|---|---|---|---|---|---|---|
|
6 months ended 30 June 2025 (Reviewed) |
||||||
|
Profit attributable to owners of the parent |
4 139 |
|||||
|
Adjusted for: |
27 |
(7) |
(5) |
15 |
||
|
– IAS 16 Net losses on disposal of property, plant and equipment |
16 |
(4) |
(3) |
9 |
||
|
– IAS 28 Share of equity-accounted investments’ separately identifiable remeasurements |
11 |
(3) |
(2) |
6 |
||
|
Headline earnings |
4 154 |
|
Gross Rm |
Tax Rm |
NCI Rm |
Net Rm |
|||
|---|---|---|---|---|---|---|
|
12 months ended 31 December 2025 (Audited) |
||||||
|
Profit attributable to owners of the parent |
7 564 |
|||||
|
Adjusted for: |
261 |
(47) |
(50) |
164 |
||
|
– IFRS 10 Gain on disposal of subsidiary |
(32) |
31 |
|
(1) |
||
|
– IAS 16 Net losses on disposal of property, plant and equipment |
243 |
(65) |
(41) |
137 |
||
|
– IAS 28 Share of equity-accounted investments’ separately identifiable remeasurements |
50 |
(13) |
(9) |
28 |
||
|
Headline earnings |
7 728 |
5. Dividend distributions
An interim cash (gross) dividend, number 47, for 2026 of 700 cents per share, was approved by the board of directors on 18 August 2026. The dividend is payable on 5 October 2026 to shareholders who will be on the register on 2 October 2026. This interim dividend, amounting to approximately R1 639 million (to external shareholders), has not been recognised as a liability in these interim financial statements. It will be recognised in shareholders’ equity in the second half of the year ending 31 December 2026.
The interim dividend, declared from income reserves, will be subject to a dividend withholding tax of 20% for all shareholders who are not exempt from or do not qualify for a reduced rate of dividend withholding tax. The net local dividend payable to shareholders, subject to dividend withholding tax at a rate of 20% amounts to 560.00000 cents per share.
The number of ordinary shares in issue at the date of this declaration is 341 913 674. Exxaro company’s tax reference number is 9218/098/14/4.
|
6 months ended 30 June 2026 Reviewed Rm |
6 months ended 30 June 2025 Reviewed Rm |
12 months ended 31 December 2025 Audited Rm |
|||
|---|---|---|---|---|---|
|
Dividends paid1 |
2 341 |
2 092 |
4 071 |
||
|
Final dividend2 |
2 341 |
2 092 |
2 092 |
||
|
Interim dividend |
1 979 |
||||
|
cents |
cents |
cents |
|||
|
Dividend paid per share |
1 000 |
866 |
1 709 |
||
|
Final dividend2 |
1 000 |
866 |
866 |
||
|
Interim dividend |
843 |
||||
|
1 Paid to external shareholders. 2 2026: Declared on 17 March 2026 and paid on 11 May 2026. |
|||||
|
At 30 June 2026 Reviewed |
At 30 June 2025 Reviewed |
At 31 December 2025 Audited |
|||
|---|---|---|---|---|---|
|
Issued share capital (number of shares)1 |
341 913 674 |
346 710 092 |
341 913 674 |
||
|
WANOS |
234 143 430 |
241 171 821 |
238 275 050 |
||
|
Diluted WANOS |
234 143 430 |
241 171 821 |
238 275 050 |
||
|
1 Includes treasury shares of 107 770 244 (30 June 2025: 107 770 244; 31 December 2025: 107 770 244). |
|||||
|
Salient dates for payment of the interim dividend are: |
|||||
|
Last day to trade cum dividend on the JSE |
Tuesday, 29 September 2026 |
||||
|
First trading day ex-dividend on the JSE |
Wednesday, 30 September 2026 |
||||
|
Record date |
Friday, 2 October 2026 |
||||
|
Payment date |
Monday, 5 October 2026 |
||||
No share certificates may be dematerialised or re-materialised between Wednesday, 30 September 2026 and Friday, 2 October 2026, both days inclusive. Dividends for certificated shareholders will be transferred electronically to their bank accounts on the payment date. Shareholders who hold dematerialised shares will have their accounts credited at their central securities depository participant or broker on Monday, 5 October 2026.
6. Segmental information
Operating segments are reported in a manner consistent with the internal reporting provided to the chief operating decision maker, who is responsible for allocating resources and assessing performance of the reportable operating segments. The chief operating decision maker has been defined as the executive committee of the group. Segments reported are based on the group’s different commodities and operations.
The performance of the operating segments is assessed based on EBITDA, which is considered to be an appropriate performance measure of profitability for the group's business and is the measure applied by management to monitor performance at a consolidated level as management believes that this measure is relevant to an understanding of the group's financial performance. EBITDA is not a defined performance measure in IFRS Accounting Standards. The group's definition of EBITDA may not be comparable with similarly titled performance measures and disclosures by other entities.
The segments, as described below, offer different goods and services, and are managed separately based on commodity, location and support function grouping. The group executive committee review internal management reports on these operating segments at least quarterly.
In line with reporting trends, emphasis is placed on controllable costs. Indirect corporate costs are reported on a gross level in the other reportable segment.
Coal
The coal operations produce thermal coal, metallurgical coal and SSCC and are made up of the following reportable segments:
Commercial Waterberg: Comprising of the Grootegeluk operation.
Commercial Mpumalanga: Comprising of the Belfast and Leeuwpan operations, as well as the 50% (30 June 2025: 50%; 31 December 2025: 50%) joint venture in Mafube with Thungela.
Tied: Comprising of the Matla operation supplying its entire coal supply to Eskom.
Other: Comprising of the other coal affiliated operations, including mines in closure and a 10.23% (30 June 2025: 10.26%; 31 December 2025: 10.26%) effective equity interest in RBCT.
Revenue and related cost items are allocated between the coal reportable segments and disclosed based on the origin of the initial coal production.
Energy
The energy operations generate electricity from renewable energy technology. The energy reportable segment comprises mainly of the Amakhala SPV and Tsitsikamma SPV windfarm operations, LSP which reached COD as well as Karreebosch which is in the construction phase.
Metals
The metals operations are made up of the following reportable segments:
Manganese: Comprising of the 50.1% joint venture in Tshipi with Jupiter Mines, the NMT group of companies, which sells manganese and renders marketing services, and the holding entities which render management services (refer note 22).
Iron ore: Comprising of the 20.62% (30 June 2025: 20.62%; 31 December 2025: 20.62%) equity interest in SIOC.
Base metals: Comprising of the 26% (30 June 2025: 26%; 31 December 2025: 26%) equity interest in Black Mountain.
Other
The other operations of the group comprise mainly of the corporate office (rendering corporate management services) and the Ferroland agricultural operation. The disposal of the FerroAlloys business and the results up to the date of the sale (31 October 2025) are included in the corresponding comparative periods.
The following tables present a summary of the group’s segmental information:
|
6 months ended 30 June 2026 (Reviewed) |
Coal |
||||||
|---|---|---|---|---|---|---|---|
|
Commercial |
|||||||
|
Waterberg Rm |
Mpuma- langa Rm |
Tied Rm |
Other Rm |
Energy Rm |
|||
|
Segmental revenue |
13 105 |
4 245 |
3 983 |
696 |
|||
|
Intergroup elimination |
(52) |
||||||
|
External revenue (note 7) |
13 105 |
4 245 |
3 983 |
644 |
|||
|
Segmental net operating profit/(loss) |
4 803 |
(79) |
93 |
(304) |
304 |
||
|
Add back: |
|||||||
|
Depreciation and amortisation (note 8) |
985 |
299 |
2 |
210 |
|||
|
Depreciation capitalised to property, plant and equipment |
(7) |
(2) |
|||||
|
Net losses on disposal of property, plant and equipment (note 8) |
12 |
||||||
|
EBITDA |
5 793 |
220 |
93 |
(302) |
512 |
||
|
Other key items: |
|||||||
|
Raw materials and consumables (note 8) |
(1 257) |
(1 347) |
(403) |
||||
|
Staff costs (note 8) |
(1 775) |
(140) |
(1 251) |
(113) |
(58) |
||
|
Royalties1 (note 8) |
(582) |
(32) |
(30) |
55 |
|||
|
Contract mining (note 8) |
(98) |
(943) |
(9) |
(2) |
|||
|
Repairs and maintenance (note 8) |
(1 031) |
(110) |
(655) |
(1) |
(6) |
||
|
Railage and transport (note 8) |
(1 910) |
(915) |
(103) |
||||
|
Movement in provisions (note 8) |
(21) |
(162) |
(32) |
(249) |
(1) |
||
|
External finance income (note 10) |
10 |
4 |
21 |
33 |
|||
|
External finance costs (note 10) |
(13) |
(102) |
(37) |
(231) |
|||
|
Share of income of equity-accounted investments (note 11) |
16 |
||||||
|
Income tax (expense)/benefit |
(1 236) |
50 |
(26) |
2 |
(36) |
||
|
Cash generated by/(utilised in) operations (note 9) |
5 984 |
396 |
458 |
(947) |
508 |
||
|
Capital spend on property, plant and equipment (note 14) |
(1 326) |
(69) |
(864) |
||||
|
At 30 June 2026 (Reviewed) |
|||||||
|
Segmental assets and liabilities |
|||||||
|
Deferred tax2 |
105 |
||||||
|
Equity-accounted investments (note 13) |
1 921 |
1 979 |
|||||
|
External assets |
33 619 |
5 233 |
1 646 |
3 160 |
12 941 |
||
|
Total assets |
33 619 |
7 154 |
1 646 |
5 139 |
13 046 |
||
|
External liabilities |
2 772 |
3 484 |
1 634 |
2 047 |
8 897 |
||
|
Deferred tax2 |
7 803 |
481 |
(43) |
72 |
1 042 |
||
|
Total liabilities |
10 575 |
3 965 |
1 591 |
2 119 |
9 939 |
||
1 Calculated per legal entity.
2 Offset per legal entity and tax authority.
|
6 months ended 30 June 2026 (Reviewed) |
Metals |
|||||||
|---|---|---|---|---|---|---|---|---|
|
Manga- nese Rm |
Iron ore Rm |
Base metals Rm |
Other Rm |
Elimina- tion Rm |
Total Rm |
|||
|
Segmental revenue |
145 |
6 |
(52) |
22 128 |
||||
|
Intergroup elimination |
52 |
|||||||
|
External revenue (note 7) |
145 |
6 |
22 128 |
|||||
|
Segmental net operating profit/(loss) |
(252) |
(534) |
4 031 |
|||||
|
Add back: |
||||||||
|
Depreciation and amortisation (note 8) |
56 |
1 552 |
||||||
|
Depreciation capitalised to property, plant and equipment |
|
(9) |
||||||
|
Net losses on disposal of property, plant and equipment (note 8) |
|
12 |
||||||
|
EBITDA |
(252) |
(478) |
5 586 |
|||||
|
Other key items: |
||||||||
|
Raw materials and consumables (note 8) |
(7) |
(3 014) |
||||||
|
Staff costs (note 8) |
(21) |
(772) |
(4 130) |
|||||
|
Royalties1 (note 8) |
|
(589) |
||||||
|
Contract mining (note 8) |
|
(1 052) |
||||||
|
Repairs and maintenance (note 8) |
(7) |
(1 810) |
||||||
|
Railage and transport (note 8) |
(5) |
(2) |
(2 935) |
|||||
|
Movement in provisions (note 8) |
6 |
(459) |
||||||
|
External finance income (note 10) |
14 |
556 |
638 |
|||||
|
External finance costs (note 10) |
(48) |
(227) |
(658) |
|||||
|
Share of income of equity-accounted investments (note 11) |
242 |
1 137 |
1 |
|
1 396 |
|||
|
Income tax (expense)/benefit |
(14) |
23 |
(1 237) |
|||||
|
Cash generated by/(utilised in) operations (note 9) |
(96) |
(180) |
6 123 |
|||||
|
Capital spend on property, plant and equipment (note 14) |
(27) |
(2 286) |
||||||
|
At 30 June 2026 (Reviewed) |
||||||||
|
Segmental assets and liabilities |
||||||||
|
Deferred tax2 |
1 |
212 |
318 |
|||||
|
Equity-accounted investments (note 13) |
9 269 |
14 616 |
2 709 |
|
30 494 |
|||
|
External assets |
3 170 |
|
14 480 |
74 249 |
||||
|
Total assets |
12 440 |
14 616 |
2 709 |
14 692 |
105 061 |
|||
|
External liabilities |
26 |
|
5 448 |
24 308 |
||||
|
Deferred tax2 |
76 |
9 431 |
||||||
|
Total liabilities |
26 |
5 524 |
33 739 |
|||||
1 Calculated per legal entity.
2 Offset per legal entity and tax authority.
|
6 months ended 30 June 2025 (Reviewed) (Re-presented)1 |
Coal |
||||||
|---|---|---|---|---|---|---|---|
|
Commercial |
|||||||
|
Waterberg Rm |
Mpuma- langa Rm |
Tied Rm |
Other Rm |
Energy Rm |
|||
|
External revenue (note 7) |
11 753 |
4 511 |
3 549 |
|
675 |
||
|
Segmental net operating profit/(loss) |
4 478 |
(67) |
95 |
(146) |
236 |
||
|
Add back: |
|||||||
|
Depreciation and amortisation (note 8) |
877 |
295 |
9 |
199 |
|||
|
Depreciation capitalised to property, plant and equipment |
(5) |
(3) |
|||||
|
Net losses on disposal of property, plant and equipment (note 8) |
14 |
2 |
|||||
|
EBITDA |
5 364 |
230 |
95 |
(137) |
432 |
||
|
Other key items: |
|||||||
|
Raw materials and consumables (note 8) |
(1 017) |
(1 320) |
(331) |
||||
|
Staff costs (note 8) |
(1 499) |
(222) |
(988) |
(228) |
(76) |
||
|
Royalties2 (note 8) |
(598) |
(26) |
(19) |
94 |
|||
|
Contract mining (note 8) |
(66) |
(797) |
(33) |
||||
|
Repairs and maintenance (note 8) |
(1 030) |
(152) |
(578) |
(2) |
(6) |
||
|
Railage and transport (note 8) |
(1 112) |
(1 182) |
(36) |
||||
|
Movement in provisions (note 8) |
(11) |
(45) |
(8) |
(21) |
(1) |
||
|
External finance income (note 10) |
9 |
5 |
20 |
30 |
|||
|
External finance costs (note 10) |
(27) |
(96) |
(45) |
(235) |
|||
|
Share of income/(loss) of equity-accounted investments (note 11) |
|
45 |
(8) |
||||
|
Income tax (expense)/benefit |
(1 162) |
40 |
(28) |
(19) |
(36) |
||
|
Cash generated by/(utilised in) operations (note 9) |
5 230 |
100 |
294 |
(386) |
232 |
||
|
Capital spend on property, plant and equipment (note 14) |
(761) |
(105) |
(1 114) |
||||
|
At 30 June 2025 (Reviewed) (Re-presented)1 |
|||||||
|
Segmental assets and liabilities |
|||||||
|
Deferred tax3 |
118 |
||||||
|
Equity-accounted investments (note 13) |
2 067 |
1 998 |
|
||||
|
External assets |
32 163 |
5 487 |
1 471 |
3 353 |
10 410 |
||
|
Total assets |
32 163 |
7 554 |
1 471 |
5 351 |
10 528 |
||
|
External liabilities |
2 025 |
2 712 |
1 362 |
1 645 |
6 841 |
||
|
Deferred tax3 |
7 490 |
611 |
(47) |
59 |
998 |
||
|
Total liabilities |
9 515 |
3 323 |
1 315 |
1 704 |
7 839 |
||
1 Re-presented to align with the change in segment presentation of 31 December 2025 to include the FerroAlloys financial results in the other segment and the introduction of a metals reportable segment.
2 Calculated per legal entity.
3 Offset per legal entity and tax authority.
|
6 months ended 30 June 2025 (Reviewed) (Re-presented)1 |
Metals1 |
||||||
|---|---|---|---|---|---|---|---|
|
Iron ore Rm |
Base metals Rm |
Other1 Rm |
Total Rm |
||||
|
External revenue (note 7) |
91 |
20 579 |
|||||
|
Segmental net operating profit/(loss) |
(464) |
4 132 |
|||||
|
Add back: |
|||||||
|
Depreciation and amortisation (note 8) |
57 |
1 437 |
|||||
|
Depreciation capitalised to property, plant and equipment |
|
(8) |
|||||
|
Net losses on disposal of property, plant and equipment (note 8) |
|
16 |
|||||
|
EBITDA |
(407) |
5 577 |
|||||
|
Other key items: |
|||||||
|
Raw materials and consumables (note 8) |
(26) |
(2 694) |
|||||
|
Staff costs (note 8) |
(587) |
(3 600) |
|||||
|
Royalties2 (note 8) |
|
(549) |
|||||
|
Contract mining (note 8) |
|
(896) |
|||||
|
Repairs and maintenance (note 8) |
(11) |
(1 779) |
|||||
|
Railage and transport (note 8) |
(2) |
(2 332) |
|||||
|
Movement in provisions (note 8) |
1 |
(85) |
|||||
|
External finance income (note 10) |
836 |
900 |
|||||
|
External finance costs (note 10) |
(164) |
(567) |
|||||
|
Share of income/(loss) of equity-accounted investments (note 11) |
1 936 |
288 |
|
2 261 |
|||
|
Income tax (expense)/benefit |
(139) |
(1 344) |
|||||
|
Cash generated by/(utilised in) operations (note 9) |
(165) |
5 305 |
|||||
|
Capital spend on property, plant and equipment (note 14) |
(6) |
(1 986) |
|||||
|
At 30 June 2025 (Reviewed) (Re-presented)1 |
|||||||
|
Segmental assets and liabilities |
|||||||
|
Deferred tax3 |
204 |
322 |
|||||
|
Equity-accounted investments (note 13) |
14 468 |
2 625 |
|
21 158 |
|||
|
External assets |
23 372 |
76 256 |
|||||
|
Total assets |
14 468 |
2 625 |
23 576 |
97 736 |
|||
|
External liabilities |
3 550 |
18 135 |
|||||
|
Deferred tax3 |
(18) |
9 093 |
|||||
|
Total liabilities |
3 532 |
27 228 |
|||||
1 Re-presented to align with the change in segment presentation of 31 December 2025 to include the FerroAlloys financial results in the other segment and the introduction of a metals reportable segment.
2 Calculated per legal entity.
3 Offset per legal entity and tax authority.
|
12 months ended 31 December 2025 (Audited) |
Coal |
||||||
|---|---|---|---|---|---|---|---|
|
Commercial |
|||||||
|
Waterberg Rm |
Mpuma- langa Rm |
Tied Rm |
Other Rm |
Energy Rm |
|||
|
External revenue (note 7) |
23 703 |
8 384 |
8 022 |
|
1 410 |
||
|
Segmental net operating profit/(loss) |
8 429 |
(727) |
191 |
(259) |
465 |
||
|
Add back: |
|||||||
|
Depreciation and amortisation (note 8) |
1 773 |
601 |
16 |
399 |
|||
|
Depreciation capitalised to property, plant and equipment |
(16) |
(5) |
|||||
|
Net losses on disposal of property, plant and equipment (note 8) |
128 |
115 |
|||||
|
Gain on disposal of subsidiary |
|
||||||
|
EBITDA |
10 314 |
(11) |
191 |
(243) |
859 |
||
|
Other key items: |
|||||||
|
Raw materials and consumables (note 8) |
(2 051) |
(2 477) |
(734) |
(4) |
(1) |
||
|
Staff costs (note 8) |
(3 086) |
(508) |
(2 206) |
(447) |
(134) |
||
|
Royalties1 (note 8) |
(1 191) |
(57) |
(57) |
191 |
|||
|
Contract mining (note 8) |
(133) |
(1 418) |
(67) |
||||
|
Repairs and maintenance (note 8) |
(2 134) |
(289) |
(1 261) |
(4) |
(13) |
||
|
Railage and transport (note 8) |
(2 661) |
(2 111) |
(128) |
||||
|
Movement in provisions (note 8) |
195 |
(349) |
(54) |
(3) |
(2) |
||
|
External finance income (note 10) |
14 |
8 |
48 |
58 |
|||
|
External finance costs (note 10) |
(56) |
(197) |
(86) |
(463) |
|||
|
Share of income/(loss) of equity-accounted investments (note 11) |
66 |
(21) |
|||||
|
Income tax (expense)/benefit |
(2 200) |
250 |
(52) |
(47) |
(89) |
||
|
Cash generated by/(utilised in) operations (note 9) |
9 602 |
141 |
138 |
(742) |
871 |
||
|
Capital spend on property, plant and equipment (note 14) |
(1 843) |
(423) |
(2 805) |
||||
|
At 31 December 2025 (Audited) |
|||||||
|
Segmental assets and liabilities |
|||||||
|
Deferred tax2 |
146 |
||||||
|
Equity-accounted investments (note 13) |
1 987 |
1 985 |
|||||
|
External assets |
32 786 |
5 270 |
1 953 |
3 088 |
12 282 |
||
|
Total assets |
32 786 |
7 257 |
1 953 |
5 073 |
12 428 |
||
|
External liabilities |
1 991 |
3 067 |
1 608 |
1 665 |
8 476 |
||
|
Deferred tax2 |
7 539 |
480 |
(45) |
120 |
1 019 |
||
|
Total liabilities |
9 530 |
3 547 |
1 563 |
1 785 |
9 495 |
||
1 Calculated per legal entity.
2 Offset per legal entity and tax authority.
|
12 months ended 31 December 2025 (Audited) |
Metals |
|||||
|---|---|---|---|---|---|---|
|
Manga- nese Rm |
Iron ore Rm |
Base metals Rm |
Other Rm |
Total Rm |
||
|
External revenue (note 7) |
252 |
41 771 |
||||
|
Segmental net operating profit/(loss) |
(178) |
(774) |
7 147 |
|||
|
Add back: |
||||||
|
Depreciation and amortisation (note 8) |
99 |
2 888 |
||||
|
Depreciation capitalised to property, plant and equipment |
(21) |
|||||
|
Net losses on disposal of property, plant and equipment (note 8) |
243 |
|||||
|
Gain on disposal of subsidiary |
(32) |
(32) |
||||
|
EBITDA |
(178) |
(707) |
10 225 |
|||
|
Other key items: |
||||||
|
Raw materials and consumables (note 8) |
(74) |
(5 341) |
||||
|
Staff costs (note 8) |
(1 163) |
(7 544) |
||||
|
Royalties1 (note 8) |
(1 114) |
|||||
|
Contract mining (note 8) |
(1 618) |
|||||
|
Repairs and maintenance (note 8) |
(22) |
(3 723) |
||||
|
Railage and transport (note 8) |
(4) |
(4 904) |
||||
|
Movement in provisions (note 8) |
2 |
(211) |
||||
|
External finance income (note 10) |
1 611 |
1 739 |
||||
|
External finance costs (note 10) |
(322) |
(1 124) |
||||
|
Share of income/(loss) of equity-accounted investments (note 11) |
3 954 |
489 |
4 488 |
|||
|
Income tax (expense)/benefit |
(252) |
(2 390) |
||||
|
Cash generated by/(utilised in) operations (note 9) |
(93) |
123 |
10 040 |
|||
|
Capital spend on property, plant and equipment (note 14) |
(28) |
(5 099) |
||||
|
At 31 December 2025 (Audited) |
||||||
|
Segmental assets and liabilities |
||||||
|
Deferred tax2 |
242 |
388 |
||||
|
Equity-accounted investments (note 13) |
14 845 |
2 775 |
21 592 |
|||
|
External assets |
25 851 |
81 230 |
||||
|
Total assets |
14 845 |
2 775 |
26 093 |
103 210 |
||
|
External liabilities |
85 |
5 767 |
22 659 |
|||
|
Deferred tax2 |
188 |
9 301 |
||||
|
Total liabilities |
85 |
5 955 |
31 960 |
|||
1 Calculated per legal entity.
2 Offset per legal entity and tax authority.
7. Revenue
Revenue is derived from contracts with customers. Revenue has been disaggregated based on timing of revenue recognition, major type of goods and services, major geographic area and major customer industries.
|
Coal |
Metals |
||||||||||||
|---|---|---|---|---|---|---|---|---|---|---|---|---|---|
|
6 months ended 30 June 2026 (Reviewed) |
Commercial |
||||||||||||
|
Water- berg Rm |
Mpuma- langa Rm |
Tied Rm |
Other Rm |
Energy Rm |
Manga- nese Rm |
Other Rm |
Total Rm |
||||||
|
Segmental revenue reconciliation |
|||||||||||||
|
External segmental revenue1 |
13 105 |
4 245 |
3 983 |
644 |
145 |
6 |
22 128 |
||||||
|
Export sales allocated to selling entity2 |
(2 737) |
(3 411) |
6 148 |
||||||||||
|
Total revenue |
10 368 |
834 |
3 983 |
6 148 |
644 |
145 |
6 |
22 128 |
|||||
|
By timing and major type of goods and services |
|||||||||||||
|
Revenue recognised at a point in time |
10 368 |
834 |
3 435 |
6 148 |
103 |
4 |
20 892 |
||||||
|
Coal |
10 368 |
834 |
3 435 |
6 148 |
20 785 |
||||||||
|
Manganese |
103 |
103 |
|||||||||||
|
Biological goods |
4 |
4 |
|||||||||||
|
Revenue recognised over time |
548 |
644 |
42 |
2 |
1 236 |
||||||||
|
Renewable energy |
644 |
644 |
|||||||||||
|
Stock yard management services |
128 |
128 |
|||||||||||
|
Marketing fee income |
39 |
39 |
|||||||||||
|
Project engineering services |
420 |
420 |
|||||||||||
|
Other services |
3 |
2 |
5 |
||||||||||
|
Total revenue |
10 368 |
834 |
3 983 |
6 148 |
644 |
145 |
6 |
22 128 |
|||||
|
By major geographic area of customer3 |
|||||||||||||
|
Domestic |
10 368 |
834 |
3 983 |
644 |
42 |
6 |
15 877 |
||||||
|
Export |
6 148 |
103 |
6 251 |
||||||||||
|
Europe4 |
1 457 |
1 457 |
|||||||||||
|
Asia5 |
4 573 |
103 |
4 676 |
||||||||||
|
Other |
118 |
118 |
|||||||||||
|
Total revenue |
10 368 |
834 |
3 983 |
6 148 |
644 |
145 |
6 |
22 128 |
|||||
|
By major customer industries |
|||||||||||||
|
Public utilities |
9 614 |
3 983 |
140 |
644 |
14 381 |
||||||||
|
Merchants |
167 |
520 |
5 881 |
6 568 |
|||||||||
|
Steel |
156 |
51 |
103 |
310 |
|||||||||
|
Mining |
29 |
220 |
42 |
2 |
293 |
||||||||
|
Manufacturing |
62 |
62 |
|||||||||||
|
Food and beverage |
123 |
123 |
|||||||||||
|
Cement |
158 |
31 |
127 |
316 |
|||||||||
|
Chemicals |
10 |
10 |
|||||||||||
|
Other |
59 |
2 |
4 |
65 |
|||||||||
|
Total revenue |
10 368 |
834 |
3 983 |
6 148 |
644 |
145 |
6 |
22 128 |
|||||
1 Coal segmental revenue is based on the origin of coal production.
2 Relates to product sold by export distribution entity.
3 Determined based on the customer supplied by Exxaro.
4 Relates mainly to Switzerland.
5 Relates mainly to Singapore.
|
6 months ended 30 June 2025 (Reviewed) (Re-presented)1 |
Coal |
||||||||||
|---|---|---|---|---|---|---|---|---|---|---|---|
|
Commercial |
|||||||||||
|
Water- berg Rm |
Mpuma- langa Rm |
Tied Rm |
Other Rm |
Energy Rm |
Other1 Rm |
Total Rm |
|||||
|
Segmental revenue reconciliation |
|||||||||||
|
External segmental revenue2 |
11 753 |
4 511 |
3 549 |
675 |
91 |
20 579 |
|||||
|
Local sales allocated to selling entity3 |
(40) |
40 |
|||||||||
|
Export sales allocated to selling entity4 |
(1 964) |
(3 534) |
5 498 |
||||||||
|
Total revenue |
9 789 |
937 |
3 589 |
5 498 |
675 |
91 |
20 579 |
||||
|
By timing and major type of goods and services |
|||||||||||
|
Revenue recognised at a point in time |
9 789 |
937 |
2 837 |
5 498 |
89 |
19 150 |
|||||
|
Coal |
9 789 |
937 |
2 837 |
5 498 |
19 061 |
||||||
|
Ferrosilicon |
86 |
86 |
|||||||||
|
Biological goods |
3 |
3 |
|||||||||
|
Revenue recognised over time |
752 |
675 |
2 |
1 429 |
|||||||
|
Renewable energy |
675 |
675 |
|||||||||
|
Stock yard management services |
140 |
140 |
|||||||||
|
Project engineering services |
612 |
612 |
|||||||||
|
Other services |
2 |
2 |
|||||||||
|
Total revenue |
9 789 |
937 |
3 589 |
5 498 |
675 |
91 |
20 579 |
||||
|
By major geographic area of customer5 |
|||||||||||
|
Domestic |
9 789 |
937 |
3 589 |
675 |
91 |
15 081 |
|||||
|
Export |
5 498 |
5 498 |
|||||||||
|
Europe6 |
1 633 |
1 633 |
|||||||||
|
Asia7 |
3 193 |
3 193 |
|||||||||
|
Other |
672 |
672 |
|||||||||
|
Total revenue |
9 789 |
937 |
3 589 |
5 498 |
675 |
91 |
20 579 |
||||
|
By major customer industries |
|||||||||||
|
Public utilities |
8 747 |
3 589 |
270 |
675 |
13 281 |
||||||
|
Merchants |
136 |
613 |
4 802 |
5 551 |
|||||||
|
Steel |
481 |
16 |
497 |
||||||||
|
Mining |
28 |
265 |
57 |
350 |
|||||||
|
Manufacturing |
45 |
28 |
73 |
||||||||
|
Food and beverage |
148 |
148 |
|||||||||
|
Cement |
137 |
39 |
277 |
453 |
|||||||
|
Chemicals |
3 |
3 |
|||||||||
|
Other |
67 |
1 |
149 |
6 |
223 |
||||||
|
Total revenue |
9 789 |
937 |
3 589 |
5 498 |
675 |
91 |
20 579 |
||||
1 Re-presented as a result of the change in segments for FerroAlloys of 31 December 2025.
2 Coal segmental revenue is based on the origin of coal production.
3 Relates to product sold to tied mine customer.
4 Relates to product sold by export distribution entity.
5 Determined based on the customer supplied by Exxaro.
6 Relates mainly to Switzerland.
7 Relates mainly to Singapore.
|
12 months ended 31 December 2025 (Audited) |
Coal |
|||||||||||
|---|---|---|---|---|---|---|---|---|---|---|---|---|
|
Commercial |
||||||||||||
|
Water- berg Rm |
Mpuma- langa Rm |
Tied Rm |
Other Rm |
Energy Rm |
Other Rm |
Total Rm |
||||||
|
Segmental revenue reconciliation |
||||||||||||
|
External segmental revenue1 |
23 703 |
8 384 |
8 022 |
1 410 |
252 |
41 771 |
||||||
|
Local sales allocated to selling entity2 |
(39) |
39 |
|
|||||||||
|
Export sales allocated to selling entity3 |
(4 307) |
(6 575) |
10 882 |
|||||||||
|
Total revenue |
19 396 |
1 770 |
8 061 |
10 882 |
1 410 |
252 |
41 771 |
|||||
|
By timing and major type of goods and services |
||||||||||||
|
Revenue recognised at a point in time |
19 396 |
1 770 |
6 331 |
10 882 |
247 |
38 626 |
||||||
|
Coal |
19 396 |
1 770 |
6 331 |
10 882 |
38 379 |
|||||||
|
Ferrosilicon |
237 |
237 |
||||||||||
|
Biological goods |
10 |
10 |
||||||||||
|
Revenue recognised over time |
1 730 |
1 410 |
5 |
3 145 |
||||||||
|
Renewable energy |
1 410 |
1 410 |
||||||||||
|
Stock yard management services |
309 |
|
309 |
|||||||||
|
Project engineering services |
1 421 |
|
1 421 |
|||||||||
|
Transportation services |
1 |
1 |
||||||||||
|
Other services |
4 |
4 |
||||||||||
|
Total revenue |
19 396 |
1 770 |
8 061 |
10 882 |
1 410 |
252 |
41 771 |
|||||
|
By major geographic area of customer4 |
||||||||||||
|
Domestic |
19 396 |
1 770 |
8 061 |
|
1 410 |
252 |
30 889 |
|||||
|
Export |
10 882 |
10 882 |
||||||||||
|
Europe5 |
3 884 |
3 884 |
||||||||||
|
Asia6 |
6 345 |
6 345 |
||||||||||
|
Other |
653 |
653 |
||||||||||
|
Total revenue |
19 396 |
1 770 |
8 061 |
10 882 |
1 410 |
252 |
41 771 |
|||||
|
By major customer industries |
||||||||||||
|
Public utilities |
17 597 |
8 061 |
614 |
1 410 |
27 682 |
|||||||
|
Merchants |
278 |
1 096 |
9 851 |
11 225 |
||||||||
|
Steel |
667 |
69 |
1 |
737 |
||||||||
|
Mining |
62 |
514 |
195 |
771 |
||||||||
|
Manufacturing |
80 |
45 |
125 |
|||||||||
|
Food and beverage |
289 |
1 |
290 |
|||||||||
|
Cement |
306 |
72 |
272 |
650 |
||||||||
|
Chemicals |
14 |
14 |
||||||||||
|
Other |
117 |
5 |
144 |
11 |
277 |
|||||||
|
Total revenue |
19 396 |
1 770 |
8 061 |
10 882 |
1 410 |
252 |
41 771 |
|||||
1 Coal segmental revenue is based on the origin of coal production.
2 Relates to product sold to tied mine customer.
3 Relates to product sold by export distribution entity.
4 Determined based on the customer supplied by Exxaro.
5 Relates mainly to Switzerland.
6 Relates mainly to Singapore.
8. Significant items included in operating expenses
|
6 months ended 30 June 2026 Reviewed Rm |
6 months ended 30 June 2025 Reviewed Rm |
12 months ended 31 December 2025 Audited Rm |
||
|---|---|---|---|---|
|
Raw materials and consumables |
(3 014) |
(2 694) |
(5 341) |
|
|
Staff costs |
(4 130) |
(3 600) |
(7 544) |
|
|
Royalties |
(589) |
(549) |
(1 114) |
|
|
Contract mining |
(1 052) |
(896) |
(1 618) |
|
|
Repairs and maintenance |
(1 810) |
(1 779) |
(3 723) |
|
|
Railage and transport |
(2 935) |
(2 332) |
(4 904) |
|
|
Movement in provisions (note 19) |
(459) |
(85) |
(211) |
|
|
Depreciation and amortisation |
(1 552) |
(1 437) |
(2 888) |
|
|
Net losses on disposal of property, plant and equipment |
(12) |
(16) |
(243) |
|
|
Net realised and unrealised currency exchange differences |
30 |
(158) |
(334) |
|
|
Legal and professional fees |
(143) |
(254) |
(690) |
|
|
Fair value loss on initial recognition of financial asset at FVOCI1 (note 22) |
(179) |
|||
|
ECLs on financial assets at amortised cost |
(26) |
18 |
43 |
1 Relates to the investment in Jupiter Mines.
9. Cash generated by operations
|
6 months ended 30 June 2026 Reviewed Rm |
6 months ended 30 June 2025 Reviewed Rm |
12 months ended 31 December 2025 Audited Rm |
||
|---|---|---|---|---|
|
Profit before tax |
5 521 |
6 726 |
12 250 |
|
|
Adjusted for: |
||||
|
Finance income |
(638) |
(900) |
(1 739) |
|
|
Finance costs |
658 |
567 |
1 124 |
|
|
Net gains relating to changes in equity-accounted investments |
(88) |
|||
|
Income from financial assets |
(26) |
|||
|
Share of income of equity-accounted investments |
(1 396) |
(2 261) |
(4 488) |
|
|
Net operating profit |
4 031 |
4 132 |
7 147 |
|
|
Non-cash movements: |
||||
|
Depreciation and amortisation |
1 552 |
1 437 |
2 888 |
|
|
ECLs on financial assets at amortised cost |
26 |
(18) |
(43) |
|
|
Write-off of trade and other receivables |
1 |
5 |
||
|
Write-off of ESD loans |
9 |
9 |
||
|
Write-off of other current assets |
2 |
6 |
21 |
|
|
Movement in provisions |
459 |
85 |
211 |
|
|
Movement in retirement employee obligations |
5 |
5 |
10 |
|
|
Net unrealised currency exchange differences |
(77) |
99 |
230 |
|
|
Fair value adjustments on financial instruments |
37 |
(273) |
(609) |
|
|
Write-down of inventories to net realisable value |
187 |
50 |
||
|
Net losses on disposal of property, plant and equipment |
12 |
16 |
243 |
|
|
Gain on disposal of subsidiary |
(32) |
|||
|
Share-based payment expense |
104 |
67 |
184 |
|
|
Hedge ineffectiveness on interest rate swaps on cash flow hedges |
4 |
6 |
10 |
|
|
Translation of net investment in foreign operations |
(1) |
|||
|
Translation of foreign currency items |
29 |
40 |
84 |
|
|
Amortisation of transaction costs prepaid |
6 |
4 |
5 |
|
|
Non-cash recoveries of tied mine income |
(27) |
(13) |
(63) |
|
|
Non-cash management fees |
11 |
9 |
58 |
|
|
Other non-cash movements |
(2) |
(4) |
(10) |
|
|
Cash generated by operations before working capital movements |
6 358 |
5 608 |
10 398 |
|
|
Working capital movements: |
||||
|
Increase in inventories |
(810) |
(410) |
(695) |
|
|
Decrease/(increase) in trade and other receivables |
419 |
561 |
(140) |
|
|
Increase/(decrease) in trade and other payables |
210 |
(399) |
640 |
|
|
Utilisation of provisions (note 19) |
(54) |
(55) |
(163) |
|
|
Cash generated by operations |
6 123 |
5 305 |
10 040 |
10. Net financing (costs)/income
|
6 months ended 30 June 2026 Reviewed Rm |
6 months ended 30 June 2025 Reviewed Rm |
12 months ended 31 December 2025 Audited Rm |
||||
|---|---|---|---|---|---|---|
|
Finance income |
638 |
900 |
1 739 |
|||
|
Interest income relating to: |
643 |
905 |
1 750 |
|||
|
– Financial assets at amortised cost |
21 |
9 |
18 |
|||
|
– Cash and cash equivalents |
591 |
860 |
1 659 |
|||
|
– Financial assets at FVPL |
26 |
34 |
58 |
|||
|
– Non-financial assets |
4 |
11 |
||||
|
– Finance leases |
1 |
2 |
4 |
|||
|
Reimbursement of interest income on environmental rehabilitation funds |
(5) |
(5) |
(11) |
|||
|
Finance costs |
(658) |
(567) |
(1 124) |
|||
|
Interest expense relating to: |
(670) |
(491) |
(1 019) |
|||
|
– Interest-bearing borrowings (note 17) |
(585) |
(468) |
(975) |
|||
|
– Financial liabilities at amortised cost |
(48) |
|||||
|
– Non-financial liabilities |
(3) |
(3) |
(2) |
|||
|
– Lease liabilities (note 18) |
(34) |
(20) |
(42) |
|||
|
Net fair value (losses)/gains on interest rate swaps designated as cash flow hedges recycled from OCI: |
(29) |
(3) |
(25) |
|||
|
– Realised fair value loss |
(57) |
(29) |
(75) |
|||
|
– Unrealised fair value gain |
28 |
26 |
50 |
|||
|
Unwinding of discount rate on rehabilitation costs (note 19) |
(171) |
(189) |
(383) |
|||
|
Recovery of unwinding of discount rate on rehabilitation costs |
19 |
18 |
37 |
|||
|
Amortisation of transaction costs |
(5) |
(3) |
(7) |
|||
|
Borrowing costs capitalised1 |
198 |
101 |
273 |
|||
|
Total net financing (costs)/income |
(20) |
333 |
615 |
1 Relates to specific borrowings utilised by Karreebosch which is in the construction phase as well as LSP which was in the construction phase until it reached COD.
11. Share of income of equity-accounted investments
|
6 months ended 30 June 2026 Reviewed Rm |
6 months ended 30 June 2025 Reviewed Rm |
12 months ended 31 December 2025 Audited Rm |
||
|---|---|---|---|---|
|
Associates |
1 138 |
2 216 |
4 422 |
|
|
SIOC |
1 137 |
1 936 |
3 954 |
|
|
RBCT |
(8) |
(21) |
||
|
Black Mountain |
1 |
288 |
489 |
|
|
Joint ventures |
258 |
45 |
66 |
|
|
Mafube |
16 |
45 |
66 |
|
|
Tshipi1 |
242 |
|||
|
Share of income of equity-accounted investments |
1 396 |
2 261 |
4 488 |
1 Refer note 22 for further details regarding the acquisition of the select manganese assets.
12. Net gains relating to changes in equity-accounted investments
|
6 months ended 30 June 2026 Reviewed Rm |
6 months ended 30 June 2025 Reviewed Rm |
12 months ended 31 December 2025 Audited Rm |
||
|---|---|---|---|---|
|
Net gains on translation differences recycled to profit or loss on liquidation of foreign associate1 |
92 |
|||
|
Gain on liquidation of investment in foreign associate1 |
2 |
|||
|
Loss on dilution of investment in associate2 |
(6) |
|||
|
Net gains relating to changes in equity-accounted investments |
88 |
1 Relates to the final liquidation of Insect Technology following a final liquidation dividend received of R2 million.
2 Relates to a dilution in the effective interest held in RBCT from 10.26% to 10.23%.
13. Equity-accounted investments
|
At 30 June 2026 Reviewed Rm |
At 30 June 2025 Reviewed Rm |
At 31 December 2025 Audited Rm |
||
|---|---|---|---|---|
|
Associates |
19 304 |
19 091 |
19 605 |
|
|
SIOC |
14 616 |
14 468 |
14 845 |
|
|
RBCT |
1 979 |
1 998 |
1 985 |
|
|
Black Mountain1 |
2 709 |
2 625 |
2 775 |
|
|
Joint ventures |
11 190 |
2 067 |
1 987 |
|
|
Mafube |
1 921 |
2 067 |
1 987 |
|
|
Tshipi2 |
9 269 |
|||
|
Total net carrying value of equity-accounted investments |
30 494 |
21 158 |
21 592 |
1 The shares in Black Mountain have been provided as security for the project financing raised by Black Mountain.
2 Refer note 22 for further details regarding the acquisition of Tshipi.
14. Capital spend and capital commitments
|
At 30 June 2026 Reviewed Rm |
At 30 June 2025 Reviewed Rm |
At 31 December 2025 Audited Rm |
||
|---|---|---|---|---|
|
Capital spend |
||||
|
To maintain operations |
1 422 |
872 |
2 295 |
|
|
To expand operations |
864 |
1 114 |
2 804 |
|
|
Total capital spend on property, plant and equipment |
2 286 |
1 986 |
5 099 |
|
|
Capital commitments |
||||
|
Contracted: |
||||
|
– Contracted for the group (owner-controlled) |
1 383 |
3 848 |
2 132 |
|
|
– Share of capital commitments of associates |
769 |
1 392 |
1 070 |
|
|
– Share of capital commitments of joint ventures |
73 |
139 |
62 |
|
|
Total contracted |
2 225 |
5 379 |
3 264 |
|
|
Authorised, but not contracted (owner-controlled) |
3 097 |
1 091 |
4 675 |
15. Other assets
|
At 30 June 2026 Reviewed Rm |
At 30 June 2025 Reviewed Rm |
At 31 December 2025 Audited Rm |
||
|---|---|---|---|---|
|
Non-current |
685 |
589 |
646 |
|
|
Reimbursements1 |
583 |
469 |
533 |
|
|
Biological assets |
46 |
38 |
46 |
|
|
Lease receivables |
|
12 |
6 |
|
|
Other |
56 |
70 |
61 |
|
|
Current |
343 |
840 |
555 |
|
|
VAT |
27 |
88 |
79 |
|
|
Diesel rebates |
37 |
61 |
35 |
|
|
Royalties |
|
103 |
||
|
Prepayments2 |
142 |
534 |
379 |
|
|
Lease receivables |
12 |
12 |
13 |
|
|
Indemnification assets3 |
72 |
|||
|
Other |
53 |
42 |
49 |
|
|
Total other assets |
1 028 |
1 429 |
1 201 |
1 Amounts recoverable from Eskom in respect of the rehabilitation, environmental expenditure and retirement employee obligations of the Matla operation.
2 Includes an amount of R92 million (30 June 2025: R513 million; 31 December 2025: R236 million) which relates to advance payments for assets under construction. The increase for 2025 related mainly to the Karreebosch project.
3 Relates to an indemnity provided under the SPAs in relation to the acquisition of the select manganese assets (refer note 22).
16. Net (debt)/cash
Net (debt)/cash is presented by the following items on the statement of financial position:
|
At 30 June 2026 Reviewed Rm |
At 30 June 2025 Reviewed Rm |
At 31 December 2025 Audited Rm |
||
|---|---|---|---|---|
|
Non-current interest-bearing debt |
(12 309) |
(6 174) |
(11 934) |
|
|
Interest-bearing borrowings |
(11 658) |
(5 871) |
(11 259) |
|
|
Lease liabilities |
(651) |
(303) |
(675) |
|
|
Current interest-bearing debt |
(1 124) |
(3 298) |
(1 042) |
|
|
Interest-bearing borrowings |
(1 018) |
(3 197) |
(938) |
|
|
Lease liabilities |
(106) |
(101) |
(104) |
|
|
Cash and cash equivalents |
12 022 |
21 920 |
23 690 |
|
|
Cash and cash equivalents |
12 022 |
21 920 |
23 690 |
|
|
Total net (debt)/cash |
(1 411) |
12 448 |
10 714 |
17. Interest-bearing borrowings
|
At 30 June 2026 Reviewed Rm |
At 30 June 2025 Reviewed Rm |
At 31 December 2025 Audited Rm |
||
|---|---|---|---|---|
|
Non-current1 |
11 658 |
5 871 |
11 259 |
|
|
Loan facility2 |
3 886 |
|
4 083 |
|
|
Project financing3 |
7 772 |
5 871 |
7 176 |
|
|
Current1 |
1 018 |
3 197 |
938 |
|
|
Loan facility2 |
458 |
2 768 |
423 |
|
|
Project financing3 |
560 |
429 |
515 |
|
|
Total interest-bearing borrowings |
12 676 |
9 068 |
12 197 |
|
|
Summary of interest-bearing borrowings by period of redemption: |
||||
|
Less than six months |
557 |
490 |
499 |
|
|
Six to 12 months |
461 |
2 707 |
439 |
|
|
Between one and two years |
1 015 |
505 |
954 |
|
|
Between two and three years |
1 141 |
620 |
1 080 |
|
|
Between three and four years |
1 289 |
745 |
1 207 |
|
|
Between four and five years |
3 502 |
892 |
3 844 |
|
|
More than five years |
4 711 |
3 109 |
4 174 |
|
|
Total interest-bearing borrowings |
12 676 |
9 068 |
12 197 |
|
|
1 Reduced by transaction costs: |
||||
|
– Non-current |
(54) |
(43) |
(58) |
|
|
– Current |
(8) |
(5) |
(9) |
|
|
2 The 2021 loan facility was refinanced on 28 November 2025. The 2021 loan facility was settled with available cash and the new loan facility was drawn down on 4 December 2025. |
||||
|
3 Interest-bearing borrowings relating to the energy operations and projects in construction. On 17 February 2025 financial close was achieved on Karreebosch SPV. |
||||
|
Analysis of movement in interest-bearing borrowings |
||||
|
At beginning of the period |
12 197 |
8 220 |
8 220 |
|
|
Interest-bearing borrowings raised |
896 |
1 289 |
7 365 |
|
|
Interest-bearing borrowings repaid |
(424) |
(404) |
(3 375) |
|
|
Interest expense (note 10) |
585 |
468 |
975 |
|
|
Interest paid |
(583) |
(474) |
(938) |
|
|
Capitalisation of transaction costs |
|
(34) |
(57) |
|
|
Amortisation of transaction costs (note 10) |
5 |
3 |
7 |
|
|
At end of the period |
12 676 |
9 068 |
12 197 |
There were no defaults or breaches in terms of the financial covenants for the interest-bearing borrowings during the reporting periods.
Below is a summary of the salient terms and conditions of the facilities at 30 June 2026:
|
Interest rate |
||||||||||
|---|---|---|---|---|---|---|---|---|---|---|
|
Facilities |
Carrying value Rm |
Undrawn portion Rm |
Security |
Debt assumed date |
Maturity date |
Interest payment basis |
Base rate |
Margin |
Effective rate for transaction costs |
|
|
Loan facility1 |
||||||||||
|
Exxaro |
||||||||||
|
Bullet term loan facility |
2 526 |
nil |
Unsecured |
28 Nov 2025 |
28 Nov 2030 |
Floating |
3-month ZARONIA + CAS |
210 basis points (2.10%) |
0.10% |
|
|
Amortised term loan facility |
1 818 |
nil |
Unsecured |
28 Nov 2025 |
28 Nov 2030 |
Floating |
3-month ZARONIA + CAS |
195 basis points (1.95%) |
0.17% |
|
|
Revolving credit facility |
nil |
5 500 |
Unsecured |
28 Nov 2025 |
28 Nov 2030 |
Floating |
1-month ZARONIA + CAS |
230 basis points (2.30%) |
N/A |
|
|
Project financing2 |
||||||||||
|
Amakhala SPV |
||||||||||
|
Term loan and reserve facility |
2 116 |
273 |
Secured |
1 Apr 2020 |
30 Jun 2031 |
Floating |
3-month JIBAR |
350 to 681 basis points |
N/A |
|
|
Term loan facility |
111 |
nil |
Secured |
1 Apr 2020 |
30 Jun 2031 |
Fixed |
9.46% up to 30 June 2026, thereafter 3-month JIBAR |
360 to 670 basis points (3.60% to 6.70%) |
N/A |
|
|
Tsitsikamma SPV |
||||||||||
|
Term loan and reserve facility |
1 341 |
148 |
Secured |
1 Apr 2020 |
31 Dec 2030 |
Floating |
3-month JIBAR |
274 basis points (2.74%) |
N/A |
|
|
LSP SPV |
||||||||||
|
Term loan and reserve facility |
1 178 |
118 |
Secured |
11 Jul 2023 |
31 Dec 2042 |
Floating |
3-month JIBAR |
250 to 360 basis points |
0.01% where applicable |
|
|
Revolving credit facility3 |
2 |
48 |
Secured |
11 Jul 2023 |
31 Dec 2026 |
Floating |
3-month JIBAR |
180 basis points (1.80%) |
N/A |
|
|
Karreebosch SPV |
||||||||||
|
Term loan, reserve and working capital facility |
3 584 |
810 |
Secured |
17 Feb 2025 |
28 Feb 2046 |
Floating |
3-month JIBAR |
180 to 300 basis points |
0.01% where applicable |
|
1 The Exxaro loan facility transitioned to ZARONIA on 30 April 2026.
2 The group’s corporate treasury function continues to monitor and manage the group’s transition to alternative rates for the project financing.
3 The availability period of the revolving credit facility was extended to 31 December 2026.
18. Lease liabilities
|
At 30 June 2026 Reviewed Rm |
At 30 June 2025 Reviewed Rm |
At 31 December 2025 Audited Rm |
||
|---|---|---|---|---|
|
Non-current |
651 |
303 |
675 |
|
|
Current |
106 |
101 |
104 |
|
|
Total lease liabilities |
757 |
404 |
779 |
|
|
Analysis of movement in lease liabilities |
||||
|
At beginning of the period |
779 |
430 |
430 |
|
|
New leases |
1 |
13 |
13 |
|
|
Disposal of subsidiary |
(5) |
|||
|
Lease remeasurement adjustments |
(4) |
(8) |
403 |
|
|
Capital repayments |
(19) |
(31) |
(62) |
|
|
– Lease payments |
(53) |
(51) |
(104) |
|
|
– Interest charges (note 10) |
34 |
20 |
42 |
|
|
At end of the period |
757 |
404 |
779 |
|
|
The lease liabilities relate to the right-of-use assets. |
||||
|
Interest is based on incremental borrowing rates ranging as follows: |
||||
|
– Local leases (%) |
8.92 to 11.75 |
10.25 to 11.75 |
8.92 to 11.75 |
19. Provisions
|
Environmental rehabilitation |
|||||||
|---|---|---|---|---|---|---|---|
|
Resto- ration Rm |
Decommis- sioning Rm |
Residual impact Rm |
Other site closure cost Rm |
Total Rm |
|||
|
At 30 June 2026 (Reviewed) |
|||||||
|
At beginning of the period |
2 491 |
343 |
1 092 |
110 |
4 036 |
||
|
Charge to operating expenses (note 8) |
316 |
14 |
122 |
7 |
459 |
||
|
Unwinding of discount rate (note 10) |
107 |
15 |
45 |
4 |
171 |
||
|
Change in provisions capitalised to property, plant and equipment |
17 |
17 |
|||||
|
Utilised during the period (note 9) |
(26) |
(2) |
(16) |
(10) |
(54) |
||
|
Total provisions at end of the period |
2 888 |
387 |
1 243 |
111 |
4 629 |
||
|
Non-current |
2 661 |
386 |
1 081 |
82 |
4 210 |
||
|
Current |
227 |
1 |
162 |
29 |
419 |
||
|
At 30 June 2025 (Reviewed) |
|||||||
|
At beginning of the period |
2 148 |
356 |
1 017 |
120 |
3 641 |
||
|
Charge to operating expenses (note 8) |
61 |
2 |
19 |
3 |
85 |
||
|
Unwinding of discount rate (note 10) |
113 |
20 |
51 |
5 |
189 |
||
|
Change in provisions capitalised to property, plant and equipment |
(1) |
8 |
7 |
||||
|
Utilised during the period (note 9) |
(27) |
(18) |
(10) |
(55) |
|||
|
Total provisions at end of the period |
2 294 |
386 |
1 069 |
118 |
3 867 |
||
|
Non-current |
2 113 |
385 |
934 |
89 |
3 521 |
||
|
Current |
181 |
1 |
135 |
29 |
346 |
||
|
At 31 December 2025 (Audited) |
|||||||
|
At beginning of the period |
2 148 |
356 |
1 017 |
120 |
3 641 |
||
|
Charge/(reversal) to operating expenses (note 8) |
214 |
(17) |
13 |
1 |
211 |
||
|
Unwinding of discount rate (note 10) |
229 |
41 |
103 |
10 |
383 |
||
|
Change in provisions capitalised to property, plant and equipment |
(1) |
(32) |
(33) |
||||
|
Utilised during the period (note 9) |
(99) |
(2) |
(41) |
(21) |
(163) |
||
|
Disposal of subsidiary |
(3) |
(3) |
|||||
|
Total provisions at end of the period |
2 491 |
343 |
1 092 |
110 |
4 036 |
||
|
Non-current |
2 312 |
342 |
950 |
77 |
3 681 |
||
|
Current |
179 |
1 |
142 |
33 |
355 |
||
20. Other liabilities
|
At 30 June 2026 Reviewed Rm |
At 30 June 2025 Reviewed Rm |
At 31 December 2025 Audited Rm |
||
|---|---|---|---|---|
|
Non-current |
50 |
68 |
39 |
|
|
Long-term incentives |
29 |
41 |
17 |
|
|
Income received in advance |
21 |
27 |
22 |
|
|
Current |
1 203 |
952 |
1 012 |
|
|
Leave pay |
327 |
291 |
300 |
|
|
Bonuses |
415 |
334 |
436 |
|
|
VAT |
151 |
164 |
103 |
|
|
Royalties |
127 |
22 |
||
|
Carbon tax |
7 |
5 |
4 |
|
|
Customer advance payments |
31 |
16 |
11 |
|
|
Other |
145 |
142 |
136 |
|
|
Total other liabilities |
1 253 |
1 020 |
1 051 |
21. Financial instruments
|
At 30 June 2026 Reviewed Rm |
At 30 June 2025 Reviewed Rm |
At 31 December 2025 Audited Rm |
||||
|---|---|---|---|---|---|---|
|
Non-current |
||||||
|
Financial assets |
||||||
|
Financial assets at FVOCI |
2 015 |
471 |
393 |
|||
|
Equity: listed – Jupiter Mines1 |
1 203 |
|||||
|
Equity: unlisted – Hotazel1 |
440 |
|||||
|
Equity: unlisted – Chifeng |
372 |
471 |
393 |
|||
|
Financial assets at FVPL |
4 471 |
4 808 |
4 340 |
|||
|
Debt: unlisted – environmental rehabilitation funds |
3 137 |
2 830 |
3 054 |
|||
|
Debt: unlisted – portfolio investments |
600 |
530 |
577 |
|||
|
Debt: unlisted – deposit facilities2 |
734 |
1 448 |
709 |
|||
|
Financial assets at amortised cost |
419 |
178 |
282 |
|||
|
ESD loans3 |
39 |
55 |
58 |
|||
|
– Gross |
68 |
92 |
88 |
|||
|
– Impairment allowances |
(29) |
(37) |
(30) |
|||
|
Vendor finance loan4 |
45 |
45 |
||||
|
– Gross |
45 |
45 |
||||
|
NCI shareholder loans |
3 |
|||||
|
– Gross |
3 |
|||||
|
Other financial assets at amortised cost |
332 |
123 |
179 |
|||
|
– Environmental rehabilitation funds |
134 |
123 |
129 |
|||
|
– Hotazel loan receivable5 |
148 |
|||||
|
– Deferred consideration receivable6 |
50 |
50 |
||||
|
– Artika loan receivable7 |
9 |
|||||
|
– Impairment allowances |
(9) |
|||||
|
Financial liabilities |
||||||
|
Financial liabilities at amortised cost |
(11 669) |
(5 941) |
(11 270) |
|||
|
Interest-bearing borrowings |
(11 658) |
(5 871) |
(11 259) |
|||
|
Other payables |
(11) |
(70) |
(11) |
|||
|
Derivative financial liabilities designated as hedging instruments |
(229) |
(260) |
(398) |
|||
|
Cash flow hedge derivatives: interest rate swaps8 |
(193) |
(198) |
(342) |
|||
|
Cash flow hedge derivatives: FECs9 |
(36) |
(62) |
(56) |
|||
1 Exxaro acquired a 19.99% equity interest in Jupiter Mines and a 9% equity interest in Hotazel as part of the acquisition of the select manganese assets transaction. Refer note 22.
2 Deposit or credit facilities that are contractual arrangements with insurance providers with an initial five-year term and are used to cover insurance claims over the term of the contracts. The balance on a facility is settled at the end of the term, net of fees, returns and claims incurred. Annual premiums are required to be placed in the facility over the term yielding returns on underlying fund portfolios.
3 Interest-free loans advanced to successful applicants in terms of the Exxaro ESD programme.
4 On 31 October 2025, a vendor finance loan was granted to Everseed Proprietary Limited as part of the disposal transaction of FerroAlloys. The vendor finance loan is secured with second ranking security which is repayable within five years and bears interest at Prime Rate plus 3.5%.
5 Interest-bearing loan which is unsecured, bears interest at Prime Rate less 1%, interest is repayable semi-annually and the capital is repayable when there is available cash.
6 A portion of the purchase price arising on the disposal transaction of FerroAlloys was deferred and is payable by Everseed Proprietary Limited as follows:
– R10 million is payable one business day which falls six months after the settlement of the Senior Debt Facility by Everseed Proprietary Limited, and
– R40 million is payable one business day which falls 18 months after the settlement of the Senior Debt Facility by Everseed Proprietary Limited.
The deferred consideration receivable accrues interest one business day after the settlement of the Senior Debt Facility by Everseed Proprietary Limited at Prime rate plus 4.5%. The Senior Debt Facility has not been settled as at 30 June 2026.
7 Interest-bearing loan which is secured, bears interest at Prime Rate plus 5% and is settled by means of an offset against the amounts owing under the offtake agreement entered into between NU and Artika.
8 Relates to interest rate swaps designated in a hedging relationship to hedge interest rate risk exposure resulting from interest payments of the project financing. The hedges have been assessed as effective.
9 Relates to FECs designated in a hedging relationship to hedge foreign exchange risk exposure on the purchase of foreign denominated capital purchases for the Karreebosch project funded by ZAR denominated project financing. The hedges have been assessed as effective.
|
At 30 June 2026 Reviewed Rm |
At 30 June 2025 Reviewed Rm |
At 31 December 2025 Audited Rm |
|||||||
|---|---|---|---|---|---|---|---|---|---|
|
Current |
|||||||||
|
Financial assets |
|||||||||
|
Financial assets at amortised cost |
16 456 |
25 940 |
28 066 |
||||||
|
ESD loans1 |
55 |
89 |
82 |
||||||
|
– Gross |
225 |
263 |
241 |
||||||
|
– Impairment allowances |
(170) |
(174) |
(159) |
||||||
|
Vendor finance loan2 |
4 |
1 |
|||||||
|
– Gross |
4 |
1 |
|||||||
|
Intervention receivable3 |
7 |
11 |
7 |
||||||
|
– Gross |
7 |
11 |
7 |
||||||
|
Investment deposits4 |
101 |
||||||||
|
– Gross |
101 |
||||||||
|
Other financial assets at amortised cost |
3 |
3 |
|||||||
|
– Deferred consideration receivable5 |
3 |
3 |
|||||||
|
– Employee receivables |
2 |
3 |
2 |
||||||
|
– Impairment allowances |
(2) |
(3) |
(2) |
||||||
|
Trade and other receivables |
4 264 |
3 920 |
4 283 |
||||||
|
Trade receivables |
4 055 |
3 809 |
4 067 |
||||||
|
– Gross |
4 181 |
3 925 |
4 187 |
||||||
|
– Impairment allowances |
(126) |
(116) |
(120) |
||||||
|
Other receivables |
209 |
111 |
216 |
||||||
|
– Gross |
212 |
119 |
219 |
||||||
|
– Impairment allowances |
(3) |
(8) |
(3) |
||||||
|
Cash and cash equivalents6 |
12 022 |
21 920 |
23 690 |
||||||
|
Financial assets at FVPL |
1 190 |
30 |
1 166 |
||||||
|
Derivative financial assets |
30 |
18 |
|||||||
|
Debt: unlisted – deposit facilities7 |
1 190 |
1 148 |
|||||||
|
Financial liabilities |
|||||||||
|
Financial liabilities at amortised cost |
(5 271) |
(6 355) |
(4 835) |
||||||
|
Interest-bearing borrowings |
(1 018) |
(3 197) |
(938) |
||||||
|
Trade and other payables |
(4 253) |
(3 158) |
(3 897) |
||||||
|
– Trade payables |
(2 338) |
(1 752) |
(2 144) |
||||||
|
– Other payables |
(1 915) |
(1 406) |
(1 753) |
||||||
|
Derivative financial liabilities designated as hedging instruments |
|
(38) |
(22) |
||||||
|
Cash flow hedge derivatives: interest rate swaps8 |
(38) |
(22) |
|||||||
1 Interest-free loans advanced to successful applicants in terms of the Exxaro ESD programme.
2 The current portion of the vendor finance loan relates to the accrued interest on the vendor finance loan granted to Everseed Proprietary Limited.
3 Relates to amounts advanced for funding of logistical projects.
4 Investment deposits with a term of three to 12 months.
5 An additional R3 million deferred consideration which is owing by Everseed Proprietary Limited on the disposal transaction of FerroAlloys will be paid as soon as Everseed Proprietary Limited establishes an employee share option trust.
6 Includes cash and cash equivalents subject to the following restrictions by project financing lenders:
– Cash of R19 million (30 June 2025: R18 million; 31 December 2025: R19 million) held for debt service
– Cash of R62 million (30 June 2025: R47 million; 31 December 2025: R49 million) held for equipment maintenance reserving
– Cash of R38 million (30 June 2025: R35 million; 31 December 2025: R36 million) restricted until debt service is fully repaid in 2031
Additionally, includes US$ denominated cash of R44 million (30 June 2025: R177 million; 31 December 2025: R91 million) designated in a hedging relationship.
7 Deposit or credit facilities that are contractual arrangements with insurance providers with an initial five-year term and are used to cover insurance claims over the term of the contracts. The balance on a facility is settled at the end of the term, net of fees, returns and claims incurred. Annual premiums are required to be placed in the facility over the term yielding returns on underlying fund portfolios. The first deposit facility term ends in 2H26.
8 Relates to interest rate swaps designated in a hedging relationship to hedge interest rate risk exposure resulting from interest payments of the project financing. The hedges have been assessed as effective.
The carrying amounts of financial instruments measured at amortised cost approximate fair value due to the nature and terms of these instruments.
The group has granted the following loan commitments:
|
At 30 June 2026 Reviewed Rm |
At 30 June 2025 Reviewed Rm |
At 31 December 2025 Audited Rm |
||
|---|---|---|---|---|
|
Total loan commitments1 |
45 |
5 |
14 |
|
|
ESD applicants2 |
45 |
5 |
14 |
|
1 The loan commitments were undrawn for the reporting periods.
2 Loans approved and awarded to successful ESD applicants.
21.1 Fair value hierarchy
The table below analyses recurring fair value measurements for financial assets and financial liabilities. These fair value measurements are categorised into different levels in the fair value hierarchy based on the inputs to the valuation techniques used. The different levels are defined as follows:
Level 1 – Quoted prices (unadjusted) in active markets for identical assets or liabilities that the group can access at the measurement date.
Level 2 – Inputs other than quoted prices included in Level 1 that are either directly or indirectly observable.
Level 3 – Inputs that are not based on observable market data (unobservable inputs).
|
At 30 June 2026 (Reviewed) |
Fair value Rm |
Level 1 Rm |
Level 2 Rm |
Level 3 Rm |
||
|---|---|---|---|---|---|---|
|
Financial assets at FVOCI |
2 015 |
1 203 |
812 |
|||
|
Equity: listed – Jupiter Mines |
1 203 |
1 203 |
||||
|
Equity: unlisted – Hotazel |
440 |
440 |
||||
|
Equity: unlisted – Chifeng |
372 |
372 |
||||
|
Financial assets at FVPL |
5 661 |
5 661 |
||||
|
Non-current debt: unlisted – environmental rehabilitation funds |
3 137 |
3 137 |
||||
|
Non-current debt: unlisted – portfolio investments |
600 |
600 |
||||
|
Non-current debt: unlisted – deposit facilities |
734 |
734 |
||||
|
Current debt: unlisted – deposit facilities |
1 190 |
1 190 |
||||
|
Derivative financial liabilities designated as hedging instruments |
(229) |
(229) |
||||
|
Non-current cash flow hedge derivatives: interest rate swaps |
(193) |
(193) |
||||
|
Non-current hedging derivatives: FECs |
(36) |
(36) |
||||
|
Net financial assets held at fair value |
7 447 |
1 203 |
5 432 |
812 |
|
At 30 June 2025 (Reviewed) |
Fair value Rm |
Level 2 Rm |
Level 3 Rm |
||
|---|---|---|---|---|---|
|
Financial assets at FVOCI |
471 |
471 |
|||
|
Equity: unlisted – Chifeng |
471 |
471 |
|||
|
Financial assets at FVPL |
4 808 |
4 808 |
|||
|
Non-current debt: unlisted – environmental rehabilitation funds |
2 830 |
2 830 |
|||
|
Non-current debt: unlisted – portfolio investments |
530 |
530 |
|||
|
Non-current debt: unlisted – deposit facilities |
1 448 |
1 448 |
|||
|
Derivative financial assets |
30 |
30 |
|||
|
Current derivative financial assets |
30 |
30 |
|||
|
Derivative financial liabilities designated as hedging instruments |
(298) |
(298) |
|||
|
Non-current cash flow hedge derivatives: interest rate swaps |
(198) |
(198) |
|||
|
Current hedging derivatives: interest rate swaps |
(38) |
(38) |
|||
|
Non-current hedging derivatives: FECs |
(62) |
(62) |
|||
|
Net financial assets held at fair value |
5 011 |
4 540 |
471 |
|
At 31 December 2025 (Audited) |
Fair value Rm |
Level 2 Rm |
Level 3 Rm |
||
|---|---|---|---|---|---|
|
Financial assets at FVOCI |
393 |
393 |
|||
|
Equity: unlisted – Chifeng |
393 |
393 |
|||
|
Financial assets at FVPL |
5 488 |
5 488 |
|||
|
Non-current debt: unlisted – environmental rehabilitation funds |
3 054 |
3 054 |
|||
|
Non-current debt: unlisted – portfolio investments |
577 |
577 |
|||
|
Non-current debt: unlisted – deposit facilities |
709 |
709 |
|||
|
Current debt: unlisted - deposit facilities |
1 148 |
1 148 |
|||
|
Derivative financial assets |
18 |
18 |
|||
|
Current derivative financial assets |
18 |
18 |
|||
|
Derivative financial liabilities designated as hedging instruments |
(420) |
(420) |
|||
|
Non-current cash flow hedge derivatives: interest rate swaps |
(342) |
(342) |
|||
|
Current hedging derivatives: interest rate swaps |
(22) |
(22) |
|||
|
Non-current hedging derivatives: FECs |
(56) |
(56) |
|||
|
Net financial assets held at fair value |
5 479 |
5 086 |
393 |
Reconciliation of financial assets within Level 3 of the hierarchy:
|
Hotazel Rm |
Chifeng Rm |
||
|---|---|---|---|
|
At 31 December 2024 (Audited) |
442 |
||
|
Movement during the period |
|||
|
Gains recognised in OCI (pre-tax effect)1 |
29 |
||
|
At 30 June 2025 (Reviewed) |
471 |
||
|
Movement during the period |
|||
|
Losses recognised in OCI (pre-tax effect)1 |
(78) |
||
|
At 31 December 2025 (Audited) |
393 |
||
|
Movement during the period |
|||
|
Acquisition2 |
1 077 |
||
|
Losses recognised in OCI (pre-tax effect)1 |
(637) |
(21) |
|
|
At 30 June 2026 (Reviewed) |
440 |
372 |
1 Tax on Hotazel amounts to nil. Tax on Chifeng amounts to nil (30 June 2025: R6.3 million; 2H25: R16.88 million).
2 On 27 February 2026, Exxaro acquired a 9% equity interest in Hotazel as part of the acquisition of the select manganese assets transaction. Refer note 22.
Transfers
Transfers between levels of the fair value hierarchy are recognised at the end of the reporting period during which the transfer has occurred. There were no transfers between Level 1 and Level 2 nor between Level 2 and Level 3 of the fair value hierarchy.
Valuation process applied
The fair value computations of investments are performed by the corporate finance department, reporting to the finance director, on a six-monthly basis. The valuation reports are discussed with the chief operating decision maker and the audit committee in accordance with Exxaro’s reporting governance.
Current derivative financial instruments
Level 2 fair values for simple over-the-counter derivative financial instruments are based on market quotes. These quotes are assessed for reasonableness by discounting estimated future cash flows using the market rate for similar instruments at measurement date.
Environmental rehabilitation funds, portfolio investments and deposit facilities
Level 2 fair values for debt instruments held in the environmental rehabilitation funds, portfolio investments and deposit facilities are based on quotes provided by the financial institutions at which the funds are invested at measurement date.
Cash flow hedge derivatives: interest rate swaps
Level 2 fair values for interest rate swaps are based on valuations provided by the financial institutions with whom the swaps have been entered into, and take into account credit risk. The valuations are assessed for reasonableness by discounting the estimated future cash flows based on observable ZAR swap curves.
Cash flow hedge derivatives: FECs
Level 2 fair values for hedge accounted FECs are based on valuations provided by the financial institutions with whom the FECs have been entered into, and take into account credit risk. The valuations are assessed for reasonableness by discounting the estimated future cash flows based on the relevant observable ZAR/foreign currency forward rates.
Valuation techniques used in the determination of fair values within Level 3 of the hierarchy
Chifeng is classified within a Level 3 of the fair value hierarchy as there is no quoted market price or observable price available for this investment. This unlisted investment is valued as the present value of the estimated future cash flows, using a DCF model. The valuation technique is consistent to that used in previous reporting periods.
Hotazel is classified within a Level 3 of the fair value hierarchy as there is no quoted market price or observable price available for this investment. This unlisted investment is valued as the present value of the estimated future cash flows, using a DCF model.
22. Acquisition of select manganese assets
As part of Exxaro’s Sustainable Growth and Impact strategy to diversify into energy transition minerals, Exxaro pursued opportunities in the manganese sector. On 13 May 2025, Exxaro (through ManganExx), entered into two separate agreements with Ntsimbintle Holdings and OMH (collectively the Sellers), respectively, to acquire the shares and certain corresponding claims held by the Sellers in and against various investee companies.
On 27 February 2026, the transactions became effective, except for the acquisition of the interest in the Mokala Mine (through an equity interest in Mokala Manganese Proprietary Limited) which is subject to further conditions precedent still to be fulfilled. The acquisition gives Exxaro a footprint in the manganese sector, positioning the group as a globally relevant manganese producer with exposure to long-life, high-quality assets situated in the Kalahari Manganese Field, one of the world’s most significant manganese regions.
Refer below for a summarised structure of the arrangement, including only entities acquired in the select manganese assets acquisition transaction:
|
|
|---|

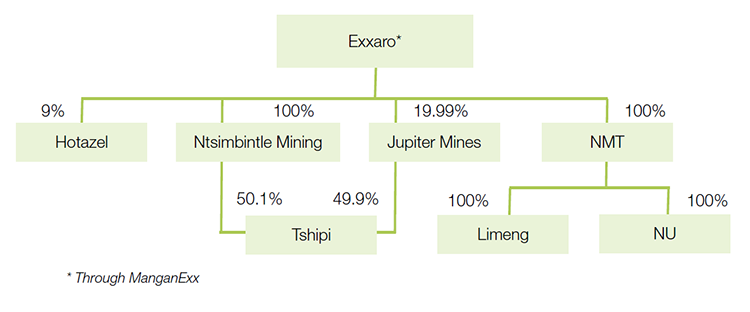
* Through ManganExx
100% equity interest of Ntsimbintle Mining
The acquisition of Ntsimbintle Mining was assessed and determined not to meet the definition of a business in terms of IFRS 3 Business Combinations (IFRS 3). Accordingly, the transaction has not been accounted for as a business combination but rather as an asset acquisition transaction.
Exxaro’s accounting policy is to recognise the identifiable assets at their relative fair values and to allocate the consideration accordingly.
The identifiable assets acquired comprise cash and cash equivalents and an equity-accounted investment in Tshipi. Cash and cash equivalents are measured in accordance with IFRS 9 Financial Instruments (IFRS 9) and are therefore not included in the allocation of the transaction price. The residual transaction price is allocated to the investment in Tshipi. As a result, the investment in Tshipi represents the residual asset to which the remaining consideration is assigned.
The result of the asset acquisition transaction is as follows:
|
Rm |
|
|---|---|
|
Consideration: |
|
|
– Purchase price paid1 |
6 788 |
|
– Assumed liability2 |
2 466 |
|
– Indemnification asset |
(72) |
|
Total consideration |
9 182 |
|
Allocation of consideration to the following assets acquired: |
|
|
– Equity-accounted investment: Tshipi |
9 126 |
|
– Cash and cash equivalents |
56 |
1 Allocated to the acquisition of the Tshipi joint venture.
2 Relates to debt acquired from the asset acquisition transaction.
100% equity interest of the NMT group of companies
Overview of the NMT group of companies
The NMT group of companies comprises of the following entities:
- NMT, a company incorporated and registered in Singapore, which conducts manganese marketing and sales and is the holding company of its subsidiaries
- Limeng, a company incorporated and registered in China, which operates a stock yard trading business
- NU, a company incorporated and registered in South Africa, whose principal activities are the marketing and trading of mineral ores
Overview of the transaction
The acquisition of the NMT group of companies met the definition of a business in accordance with IFRS 3 and has therefore been accounted for as a business combination.
On 27 February 2026, Exxaro obtained control of the NMT group of companies. Consequently, from that date, the assets acquired, liabilities assumed and results of the operations of the NMT group of companies have been consolidated into these condensed group interim financial statements in accordance with IFRS 3 and the relevant consolidation requirements.
The related cost associated with the acquisition of the NMT group of companies was expensed through profit and loss. An amount of R178 million has been expensed through operating expenses in 2025 and R53 million has been expensed through operating expenses in 2026.
The fair value of the 100% controlling interest acquired and its attribution to the net identifiable assets acquired and resultant goodwill is summarised below:
|
Rm |
|
|---|---|
|
Consideration transferred |
1 101 |
|
Less: Net identifiable assets at fair value |
(202) |
|
Goodwill |
899 |
|
The transaction resulted in the following net cash outflow from investing activities: |
|
|
Rm |
|
|
Cash paid |
1 101 |
|
Cash and cash equivalents acquired |
(82) |
|
Net cash outflow relating to the acquisition of subsidiaries |
1 019 |
Purchase consideration
The purchase consideration for the NMT group of companies amounted to R1 101 million and was fully settled in cash on the acquisition date.
Goodwill
Goodwill represents the residual value between the fair value of the 100% controlling interest acquired and the net identifiable assets recognised. The value of goodwill is attributed to the value of other items at acquisition date which are not separately identifiable to achieve recognition as intangible assets.
The goodwill recognised is mainly attributed to:
- The established and experienced workforce of the NMT group of companies
- The premium associated with the limited investment opportunities into manganese projects
The goodwill is not deductible for tax purposes.
Identifiable assets acquired and liabilities assumed
The fair value of the identifiable assets acquired, and liabilities assumed of the NMT group of companies as at the acquisition date are summarised as follows:
|
Non-current Rm |
Current Rm |
Total Rm |
|
|---|---|---|---|
|
Financial asset at amortised cost |
9 |
9 |
|
|
Deferred tax assets |
1 |
1 |
|
|
Other assets |
2 |
2 |
|
|
Inventories |
98 |
98 |
|
|
Trade and other receivables |
26 |
26 |
|
|
Cash and cash equivalents |
82 |
82 |
|
|
Trade and other payables |
(5) |
(5) |
|
|
Current tax payables |
(5) |
(5) |
|
|
Other liabilities |
(6) |
(6) |
|
|
Net identifiable assets |
10 |
192 |
202 |
The initial accounting for the acquisition remains provisional, pending the final determination of the fair values attributable to the identifiable assets acquired and liabilities assumed, as well as the resulting goodwill arising from the transaction.
19.99% equity interest of Jupiter Mines
Exxaro has elected to designate the equity investment in Jupiter Mines as a financial asset measured subsequently at FVOCI. On initial recognition, the group recognised a loss of R179 million in profit or loss which arose as a result of the difference between the fair value (Level 1) at initial recognition and the purchase price of the investment. Subsequent changes in the fair value of the investment are, and will continue, to be recognised in OCI.
|
Rm |
|
|---|---|
|
Fair value (Level 1) |
1 335 |
|
Purchase price paid |
(1 514) |
|
Day-one loss |
(179) |
9% equity interest of Hotazel
Exxaro has elected to designate the equity investment in Hotazel as a financial asset measured subsequently at FVOCI. On initial recognition, the group recognised the investment at the purchase price of R1 077 million, which was considered to be representative of its fair value. Subsequent changes in the fair value of the investment are, and will continue to be recognised in OCI.
Hotazel sale claims
The Hotazel sales claims have been recognised as a financial asset measured at amortised cost. The purchase price for the Hotazel sale claims amounted to R143 million.
Safika contracts
Safika had an existing contractual agreement entitling it to receive future management fees from Tshipi. In terms of the SPA, Exxaro paid Safika to acquire the right, following which Safika ceded all its rights, title and interest in the contract to Exxaro. The acquired contractual right is separately identifiable, arises from legal rights and is expected to generate future economic benefits through the future management fee cash flows for Exxaro. Accordingly, the transaction gave rise to the recognition of a separate intangible asset, which was initially measured at a cost of R84 million.
23. Contingent liabilities and contingent assets
23.1 Contingent liabilities
|
At 30 June 2026 Reviewed Rm |
At 30 June 2025 Reviewed Rm |
At 31 December 2025 Audited Rm |
||
|---|---|---|---|---|
|
Pending litigation and other claims1 |
107 |
107 |
107 |
|
|
Operational guarantees2 |
4 802 |
5 005 |
4 802 |
|
|
– Financial guarantees ceded to the DMPR |
3 503 |
3 504 |
3 503 |
|
|
– Other financial guarantees |
1 299 |
1 501 |
1 299 |
|
|
Total contingent liabilities |
4 909 |
5 112 |
4 909 |
1 Relates to commercial disputes of which the outcome is uncertain.
2 Includes guarantees to banks and other institutions in the normal course of business from which it is anticipated that no material liabilities will arise.
Exxaro continues to follow the legal process in relation to the coal mine dust class action suit which is currently underway. As part of Exxaro's response to the matter, we have been engaging meaningfully with affected parties. While the litigation unfolds, we are responding to the intervention/joinder application however, there is no view at this stage of when the certification will be heard.
Exxaro continues to be committed to the health and safety of our employees, and we ensure that our operations continue to comply with regulations with reference to preventing and curbing occupational diseases, in line with our Sustainable Growth and Impact strategy.
The timing and occurrence of any possible outflows of the contingent liabilities are uncertain.
Share of equity-accounted investments’ contingent liabilities
|
At 30 June 2026 Reviewed Rm |
At 30 June 2025 Reviewed Rm |
At 31 December 2025 Audited Rm |
|
|---|---|---|---|
|
Share of contingent liabilities of equity-accounted investments1 |
3 527 |
1 698 |
1 716 |
1 Increase mainly relates to the scheduled closure cost at the end of LoM for the newly acquired interest in Tshipi.
23.2 Contingent assets
|
At 30 June 2026 Reviewed Rm |
At 30 June 2025 Reviewed Rm |
At 31 December 2025 Audited Rm |
||
|---|---|---|---|---|
|
Back-to-back guarantees |
134 |
134 |
134 |
|
|
Other1 |
89 |
94 |
25 |
|
|
Total contingent assets |
223 |
228 |
159 |
1 Relates to performance guarantees issued to Exxaro in terms of various capital project agreements.
24. Related party transactions
The group entered into various sale and purchase transactions with its associates and joint ventures during the ordinary course of business. These transactions were subject to terms that are no less, nor more favourable than those arranged with independent third parties.
|
At 30 June 2026 Reviewed Rm |
At 30 June 2025 Reviewed Rm |
At 31 December 2025 Audited Rm |
||
|---|---|---|---|---|
|
Items of income/(expense) recognised during the period |
||||
|
Sales of goods and services rendered |
||||
|
– Associates |
73 |
|||
|
– Joint ventures |
67 |
23 |
48 |
|
|
Purchases of goods and services rendered |
||||
|
– Associates |
(84) |
(79) |
(154) |
|
|
– Joint ventures |
(812) |
(816) |
(1 587) |
|
|
Outstanding balances at end of the period |
||||
|
Included in trade and other receivables |
||||
|
– Associates |
41 |
26 |
30 |
|
|
– Joint ventures |
56 |
10 |
5 |
|
|
Included in trade and other payables |
||||
|
– Associates |
(7) |
(5) |
||
|
– Joint ventures |
(138) |
(164) |
(142) |
25. Going concern
Based on the latest results for the six-month period ended 30 June 2026, the latest board approved budget for 2026, the outlook up to 2027 as well as the available banking facilities and cash generating capability, Exxaro satisfies the criteria of a going concern in the foreseeable future.
26. Events after the reporting period
Details of the interim dividend are provided in note 5.
The directors are not aware of any other significant matter or circumstance arising after the reporting period up to the date of this report, not otherwise dealt with in this report.
27. External auditor’s review conclusion
The company’s external auditor, KPMG Inc., has issued their unmodified review report on the reviewed condensed group interim financial statements for the six-month period ended 30 June 2026 (as set out on Condensed group statement of comprehensive income to note 26). The review was conducted in accordance with ISRE 2410 Review of Interim Financial Information Performed by the Independent Auditor of the Entity. The external auditor’s report on the reviewed interim financial statements is included on Independent auditor’s report on the review of the condensed group interim financial statements.
28. Other key measures
|
At 30 June 2026 Unreviewed |
At 30 June 2025 Unreviewed |
At 31 December 2025 Unreviewed |
||
|---|---|---|---|---|
|
Closing share price (rand per share) |
202.98 |
146.93 |
179.00 |
|
|
Market capitalisation (Rbn) |
69.40 |
50.94 |
61.20 |
|
|
Average rand/US$ exchange rate |
16.41 |
18.38 |
17.86 |
|
|
Closing rand/US$ spot exchange rate |
16.46 |
17.80 |
16.51 |