Integrated report 2019

Exxaro Resources Limited
Integrated report 2019


Riaan Koppeschaar
Finance director

Despite the challenging macro-economic environment impacting the core results from our own managed operations, the contribution from our non-managed operations showed a significant increase, resulting in core headline earnings rising to R7.4 billion compared to R7.2 billion in 2018. We are pleased to have declared total dividends of R23.27 per share to our shareholders compared to R23.40 in 2018.
* EBITDA is calculated by adjusting net operating profit before tax with depreciation, amortisation, impairment charges/reversals and net loss or gain on disposal of assets and investments (including translation differences recycled to profit or loss).
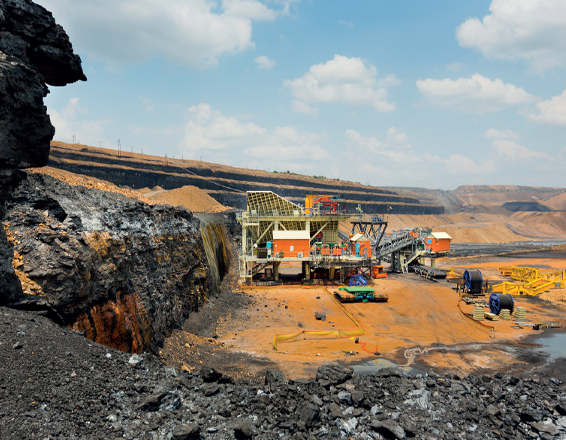
In the domestic market, steam coal demand remained stable with Eskom demand varying due to lower offtake from the Medupi power station offset by additional offtake from the Leeuwpan and ECC operations. ArcelorMittal demand varied due to fluctuations in its kiln operations as well as the steel plant in Saldanha being placed on care and maintenance. Exxaro has successfully placed the ArcelorMittal material in the market with other customers.
Overall, the thermal coal seaborne market remained in oversupply. However, price support for the API4 was evident towards the end of 2019 but the sharp increase in API4, priced South African producers out of their natural markets. The competition in our markets is intensifying with traditional Atlantic Ocean suppliers competing aggressively. The API4 averaged US$72 per tonne compared to US$98 per tonne in 2018. Export sales volumes increased 14% from 8.0Mt in 2018 to 9.1Mt in 2019.
In terms of our capital allocation framework, free cash flow generated will be prioritised as in the diagram below:
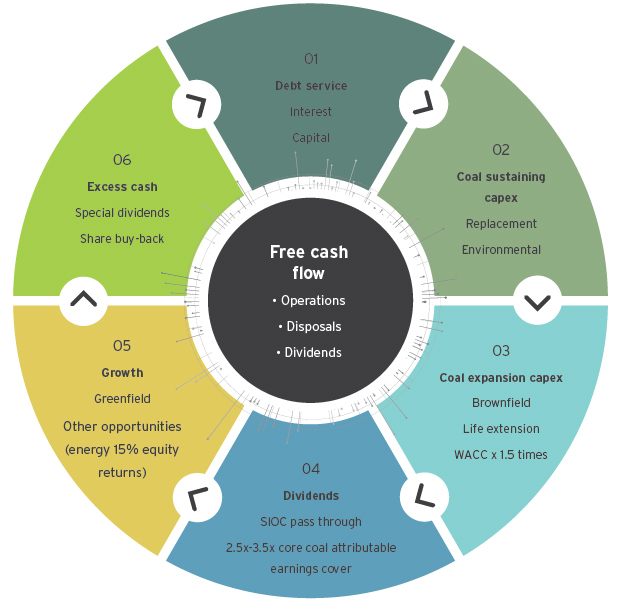
During 2019, we received cash of R13.4 billion, comprising R4.1 billion from our operations (net of tax paid), proceeds of R5.1 billion from the partial disposal of Tronox Holdings plc and the redemption of our membership interest in Tronox UK as well as dividend income received from our equity-accounted investments of R4.2 billion.
In terms of our capital allocation model, we then used this to:
Net debt also increased by R519 million as a result of the implementation of IFRS 16 Leases, which resulted in the recognition of lease liabilities. The dividends received by Eyesizwe resulted in the full settlement of the preference share liability in October 2019.
The closing net debt position at 31 December 2019 is therefore R5 810 million culminating in a:
We are proud to report that Eyesizwe, our BEE shareholder, has fully settled its acquisition debt in October 2019, three years earlier than anticipated. The early settlement was funded from dividends received from Exxaro. From an accounting perspective, this resulted in the outside shareholders of Eyesizwe being treated as non-controlling interests for the Exxaro group from 1 November 2019.
Given our strong balance sheet, underpinned by strong cash flow generation, the board approved a final dividend of 566 cents per share in line with our dividend policy:
Exxaro paid the following dividends during 2019:
| Revenue | EBITDA | |
 |
 |
|
 |
 |
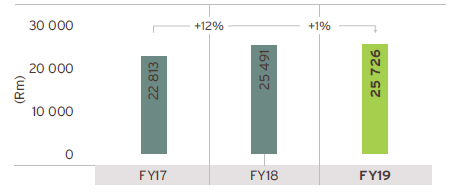
Group revenue was up 1% to R25 726 million (2018: R25 491 million). While coal export volumes increased by 14%, there was a significant decline in the API4 price resulting in a 30% lower average price per tonne achieved of US$54 (2018: US$77). The negative impact was cushioned somewhat by a weaker average spot exchange rate of R14.44 to the US dollar (2018: R13.24). On the domestic front, while higher prices from commercial mines had a positive revenue impact, this was offset by lower production volumes when compared to the previous year.
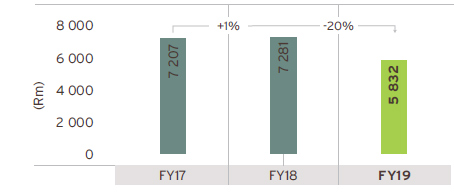
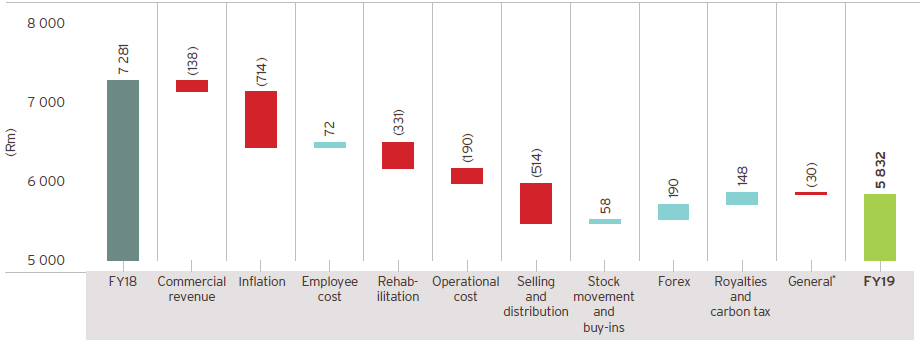
Group core EBITDA, which represents our own managed operations, decreased by 20% to R5 832 million (2018: R7 281 million).
Group core EBITDA — FY18 VERSUS FY19
* Total EBITDA variance for Matla included in General = R15 million.
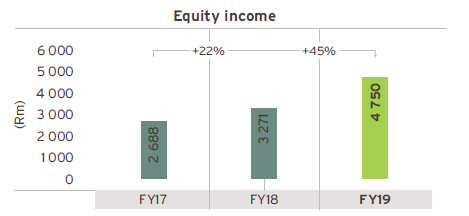
The table below shows a full breakdown of core equity-accounted income.
| Core equity-accounted income/(loss) |
Dividend income | ||||||||
| 2019 | 2018 | 2019 | 2018 | ||||||
| Coal: Mafube | 127 | 113 | |||||||
|---|---|---|---|---|---|---|---|---|---|
| Coal: RBCT | 3 | (34) | |||||||
| Ferrous: SIOC | 4 423 | 2 605 | 4 051 | 2 569 | |||||
| TiO2: Tronox SA | 236 | 381 | |||||||
| : Tronox UK1 | 110 | ||||||||
| : Tronox Holdings plc2 | 47 | 69 | |||||||
| Energy3 | 17 | 60 | 95 | 58 | |||||
| Other: Other4 | (56) | 36 | |||||||
| Total | 4 750 | 3 271 | 4 193 | 2 696 | |||||
| 1 | Application of the equity method ceased when the investment was classified as a non-current asset held-for-sale on 30 November 2018. On 15 February 2019, the 26% Tronox UK membership interest was redeemed. |
| 2 | Application of the equity method ceased when the investment was classified as a non-current asset held-for-sale on 30 September 2017. |
| 3 | Includes equity-accounted income for Cennergi of R45 million (2018: R65 million profit) and equity-accounted loss for LightApp of R28 million (2018: R5 million). The dividend received for both periods is from Cennergi. |
| 4 | Includes equity-accounted profit for Black Mountain of R51 million (2018: R70 million) and equity-accounted loss for Insect Technology of R103 million (2018: R31 million) and equity-accounted loss for Curapipe of R4 million (2018: R3 million). |
The negative revenue impact is mostly due to lower export prices partially offset by higher revenue in the domestic market. Inflation on labour is calculated at a group specific rate of 7.3%, electricity at mine-specific rates averaging 6.9% and inflation on the rest of the costs at PPI of 4.5%.
The positive variance on employee cost is mainly due to the North Block Complex divestment in the second half of 2018 and lower bonus payments in line with lower profitability. This was partially offset by higher amounts incurred due to the implementation of an additional shift at our Grootegeluk mine.
The increase in rehabilitation cost is mainly driven by revised cost estimates received from external environmental specialists in preparation for the revised legislation expected to become effective in June 2021, and relates mainly to our mines in closure (Hlobane and Durnacol).
Operational cost was higher mainly due to the higher stripping costs at our Leeuwpan, Belfast and ECC mines related to the higher RoM tonnes that were removed.
The negative variance on selling and distribution costs is in line with higher export sales volumes as well as first tonnages from our Belfast mine.
The net positive forex variance is a combination of realised and unrealised forex differences on export sales as a result of the weaker rand/US$ exchange rate in 2019.
Lower profitability, a combination of rates used in the calculation and the amount of capital expenditure qualifying to be redeemed against revenue resulted in lower royalties in 2019.
Core equity-accounted income from associates and joint ventures increased 45% to R4 750 million (2018: R3 271 million), mainly as a result of SIOC.
As announced on 17 September 2019, Exxaro has concluded an agreement with Khopoli, a wholly owned subsidiary of Tata Power, to acquire Khopoli's 50% shareholding in Cennergi for an amount of R1 550 million, subject to normal working capital adjustments. The transaction will be effective on 1 April 2020 and Exxaro will then own 100% of Cennergi.
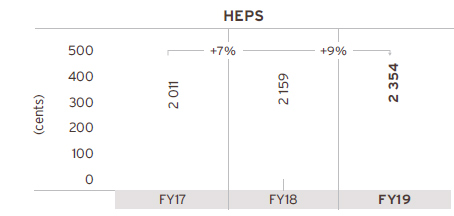
Core headline earnings were 3% higher at R7 402 million (2018: R7 167 million) or 2 354 cents per share (2018: 2 159 cents per share), based on core weighted average number of shares (WANOS) of 332 million shares from January to October 2019 and core WANOS of 251 million shares for November and December 2019 (2018: 332 million shares).
Summarised statement of financial position (Rm)
| 2019 Rm |
2018 Rm |
||||
| Assets | |||||
| Non-current assets | 57 106 | 52 226 | |||
| Property, plant and equipment | 33 562 | 28 825 | |||
| Equity-accounted investments | 16 630 | 17 046 | |||
| Financial assets | 2 674 | 2 634 | |||
| Other assets | 4 240 | 3 721 | |||
| Current assets | 9 121 | 7 641 | |||
| Inventories | 1 809 | 1 604 | |||
| Trade and other receivables | 3 241 | 3 140 | |||
| Cash and cash equivalents | 2 695 | 2 080 | |||
| Other assets | 1 376 | 817 | |||
| Non-current assets held-for-sale | 2 613 | 5 183 | |||
| Total assets | 68 840 | 65 050 | |||
| Equity and liabilities | |||||
| Total equity | 42 887 | 41 145 | |||
| Equity attributable to owners of the parent | 34 776 | 41 846 | |||
| Non-controlling interests | 8 111 | (701) | |||
| Non-current liabilities | 19 364 | 15 745 | |||
| Interest-bearing borrowings | 6 991 | 3 843 | |||
| Provisions | 4 305 | 3 952 | |||
| Deferred tax | 7 138 | 6 874 | |||
| Other liabilities | 930 | 1 076 | |||
| Current liabilities | 5 179 | 6 823 | |||
| Interest-bearing borrowings | 50 | 571 | |||
| Trade and other payables | 2 603 | 2 960 | |||
| Overdraft | 976 | 1 531 | |||
| Other liabilities | 1 550 | 1 761 | |||
| Non-current liabilities held-for-sale | 1 410 | 1 337 | |||
| Total equity and liabilities | 68 840 | 65 050 |
Property, plant and equipment increased by R4 737 million when compared to 2018, which includes a R2 245 million spend on sustaining and environmental capital (stay-in-business capital) and R3 572 million on new capacity (expansion capital). Expansion capital mainly related to the Belfast and GG6 projects.
Cash and cash equivalents increased 30% to R2 695 million when compared to the previous year. Cash flow generated by operations of R5 273 million (2018: R7 024 million) and dividends received from investments of R4 193 million (2018: R2 696 million) were sufficient to cover our capital expenditure and ordinary dividends paid. Total dividends received from our investment in SIOC was R4 051 million (2018: R2 569 million). SIOC has declared a final dividend to its shareholders in February 2020, amounting to R1 412 million for Exxaro's 20.62% shareholding. The dividend will be accounted for in the first half of 2020.
Net debt for the year ended 31 December 2019 increased by R1 943 million to R5 810 million (2018: R3 867 million). In addition to our capital expenditure programme, we paid R344 million in respect of the ECC contingent consideration, R678 million for the acquisition of shares in the market to settle share-based payments and R263 million being the deferred consideration relating to Insect Technology.
In addition to the cash generated from our own operations and dividends received, we also received R2 057 million from Tronox UK for the redemption of Exxaro's 26% membership interest, and R2 889 million from Tronox Holdings plc for the repurchase of 14 million shares from Exxaro. Of the cash received, 65% was returned to shareholders in the form of a special dividend.
Group FY19 net debt
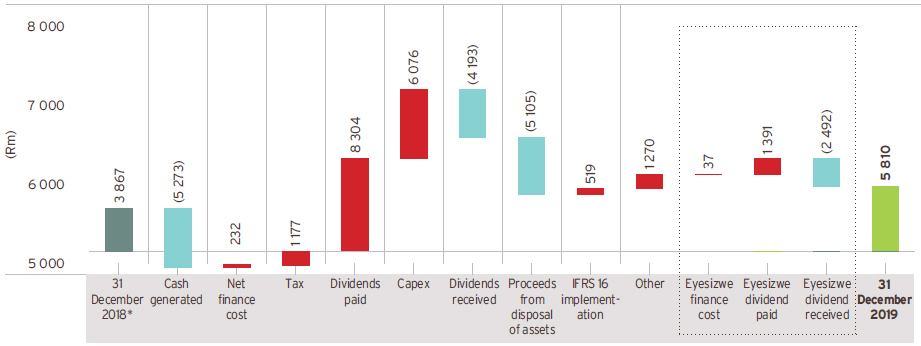
* Eyesizwe debt = R609 million; Exxaro net debt = R3 258 million.
During the second half of 2019, the Exxaro board of directors approved a decision to divest from its 26% interest in Black Mountain. On 30 November 2019, the investment was classified as a non-current asset held-for-sale and the application of the equity method ceased.
On 31 January 2020, the Arnot operation was transferred to Arnot OpCo Proprietary Limited Consortium. The transfer will be accounted for in 2020.
On 20 February 2020, Exxaro announced our intention to divest our entire interest in ECC and the Leeuwpan operations. The divestment will be executed through a formal disposal process.
The proposed transaction is a category two transaction in terms of the JSE Listings Requirements and is therefore not regarded as material.
Matla's mining right lapsed in November 2019. A compliant mining right renewal application was submitted in August 2019.
The achievement of our key financial performance indicators is presented in the table below.
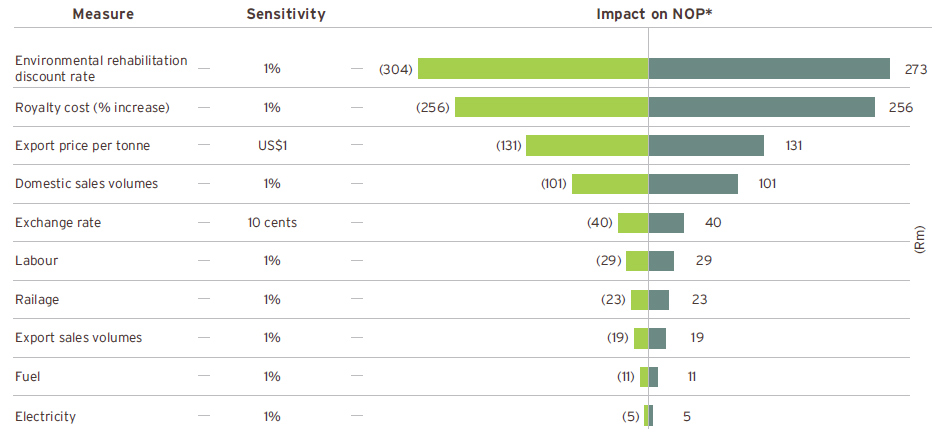
While we did not attain our core operating margin target our debt ratios are well within target, indicating a healthy balance sheet. The impact of various coal sensitivity measures as well as the key financial risk factors can be further used to stress test our current headroom.
We have comfortably met all our bank covenants for the year ended 31 December 2019 as well as the previous financial year.
| Internal key performance indicators | Target | 2019 | 2018 | |||
| EBITDA interest cover (times) | >4 | 160 | 22 | |||
|---|---|---|---|---|---|---|
| Core net operating margin (%) | >20 | 15 | 22 | |||
| Return on capital employed (%) | >20 | 28 | 23 | |||
| Net debt:equity (%) | <40 | 13 | 9 | |||
| Net debt:EBITDA (times) | <1.5 | 1.0 | 0.6 | |||
| Bank covenants1 | ||||||
| Net debt:equity (%) | <80 | 17 | 12 | |||
| EBITDA interest cover (times) | >4 | 19 | 20 | |||
| Net debt:EBITDA (times) | <3 | 0.7 | 0.5 |
1 Includes dividends received from investments in associates and contingent liabilities (excluding Department of Mineral Resources and Energy guarantees).
* Net operating profit
The group's corporate treasury function provides financial risk management services to the business, coordinates access to domestic and international financial markets, and monitors and manages the financial risks related to the operations of the group through internal risk reports, which analyse exposure by degree and magnitude of risks. The risks include market risk (including foreign currency risk, interest rate risk and price risk), credit risk and liquidity risk.
In managing its capital, the group focuses on a sound net debt position, return on shareholders' equity (or return on capital employed) and the level of dividends to shareholders. The group's policy is to cover its annual net funding requirements through long-term loan facilities with maturities spread over time.
Market risk is the risk that changes in market prices, such as foreign exchange rates, interest rates, commodity prices and equity prices, will affect the group's income or the value of its holdings of financial instruments.
The objective of market risk management is to manage and control market risk exposure within acceptable parameters while optimising the return on risk.
The group's activities expose it primarily to the financial risks of foreign currency exchange rates, commodity prices, interest rates and changes in the environmental rehabilitation funds' portfolio of assets' quoted prices.
The group's exposure to price risk in relation to quoted prices of the environmental rehabilitation funds is not considered a significant risk as the funds are invested with reputable financial institutions in accordance with a strict mandate to ensure capital preservation and growth. The funds are held for strategic purposes rather than trading purposes.
The group undertakes transactions denominated in foreign currencies hence exposures to exchange rate fluctuations arise. The currency in which transactions are entered into is mainly denominated in US dollar, euro and Australian dollar. Exchange rate exposures are managed within approved policy parameters utilising FECs, currency options and currency swap agreements.
The group maintains a fully covered exchange rate position in respect of foreign balances (if any) and imported capital equipment resulting in these exposures being fully converted to rand.
Uncovered foreign debtors at 31 December 2019 amount to nil (2018: US$0.29), whereas uncovered cash and cash equivalents amount to US$89.81 million (2018: US$37.29 million).
All capital imports were fully hedged. Monetary items have been translated at the closing rate at the last day of the reporting period US$1:R14.13 (2018: US$1:R14.43).
Trade-related import exposures are managed through the use of economic hedges arising from export revenue as well as through FECs. Trade-related export exposures are hedged using FECs and options with specific focus on short-term receivables. The FECs used to hedge foreign currency exposure mostly have a maturity of less than one year from the reporting date.
The following significant exchange rates applied during the year:
| 2019 | 2018 | |||||||||||
| Average spot rate |
Average achieved rate |
Closing spot rate |
Average spot rate |
Average achieved rate |
Closing spot rate |
|||||||
| US$ | 14.44 | 14.73 | 14.13 | 13.24 | 12.93 | 14.43 | ||||||
|---|---|---|---|---|---|---|---|---|---|---|---|---|
| € | 16.16 | 15.83 | 15.60 | 16.50 | ||||||||
| AU$ | 10.05 | 9.90 | 9.88 | 10.19 |
The group is exposed to interest rate risk as it borrows and deposits funds at floating interest rates in the money market, bond market and extended bank borrowings.
The financial institutions chosen are subject to compliance with the relevant regulatory bodies. The interest-bearing borrowings were entered into at floating interest rates in anticipation of a decrease in the interest rate cycle.
The interest rate repricing profile for interest-bearing borrowings is summarised as follows:
| One to six months Rm |
Total borrowings Rm |
|||
| At 31 December 2019 | ||||
| Non-current interest-bearing borrowings | 6 991 | 6 991 | ||
| Current interest-bearing borrowings | 50 | 50 | ||
| Total borrowings | 7 041 | 7 041 | ||
| Total borrowings (%) | 100 | 100 | ||
| At 31 December 2018 | ||||
| Non-current interest-bearing borrowings | 3 843 | 3 843 | ||
| Current interest-bearing borrowings | 571 | 571 | ||
| Total borrowings | 4 414 | 4 414 | ||
| Total borrowings (%) | 100 | 100 |
Interest-rate sensitivity
The following table reflects the potential impact on earnings, given an increase in interest rates of 50 basis points:
| Loss | ||||
| 2019 Rm |
2018 Rm |
|||
|---|---|---|---|---|
| Increase of 50 basis points in interest rate | (35) | (37) | ||
Liquidity risk is the risk that the group will not be able to meet its financial obligations as they fall due. The group's approach to managing liquidity is to ensure, as far as possible, that it will always have sufficient liquidity to meet its liabilities when due, under normal and stressed conditions, without incurring unacceptable losses or risking damage to the group's reputation.
The ultimate responsibility for liquidity risk management rests with the board of directors, which has built an appropriate liquidity risk management framework for the management of the group's short, medium and long-term funding and liquidity management requirements.
The group manages liquidity risk by monitoring forecast cash flow in compliance with loan covenants and ensuring that adequate unutilised borrowing facilities are maintained.
Borrowing capacity is determined by the directors, from time to time.
| Group | ||||
| 2019 Rm |
2018 Rm |
|||
|---|---|---|---|---|
| Amount approved1 | 43 470 | 52 308 | ||
| Total borrowings | (7 041) | (4 414) | ||
| Unutilised borrowing capacity | 36 429 | 47 894 | ||
1 Decrease mainly relates to the increase in NCI.
The group's capital base, the borrowing powers of the company and the group were set at 125% of shareholders' funds for the 2019 and 2018 financial years.
To avoid incurring interest on late payments, financial risk management policies and procedures are entrenched to ensure the timeous matching of orders placed with goods received notes or services acceptances and invoices.
Credit risk relates to potential default by counterparties on cash and cash equivalents, loans, investments, trade receivables and other receivables.
The group limits its counterparty exposure arising from money market and derivative instruments by only dealing with well-established financial institutions of high credit standing. The group exposure and the credit ratings of its counterparties are continuously monitored and the aggregate value of transactions concluded are spread among approved counterparties. Credit exposure is controlled by counterparty limits that are reviewed and approved by the board of directors annually.
Exxaro has concentration risk as a result of its exposure to one major customer: Eskom. To date the customer adheres to the stipulated payment terms.
Exxaro establishes an allowance for non-recoverability or impairment that represent its estimate of expected credit losses in respect of trade receivables, other receivables, loans, cash and cash equivalents and investments. The main components of these allowances are a 12-month expected credit loss component that result from possible default events within the 12 months after the reporting date and a lifetime expected credit loss component that results from all possible default events over the expected life of a financial instrument.
The carrying amount of financial assets represents the maximum credit exposure. None of the financial assets below were held as collateral for any security provided.
Detail of the trade receivables credit risk exposure:
| Group | ||||
| 2019 % |
2018 % |
|||
|---|---|---|---|---|
| By geographical area | ||||
| RSA | 65 | 66 | ||
| Europe | 17 | 21 | ||
| Asia | 16 | 11 | ||
| USA | 2 | 2 | ||
| Total | 100 | 100 | ||
| By industry | ||||
| Public utilities | 53 | 45 | ||
| Structural metal | 2 | |||
| Cement | 1 | 1 | ||
| Mining | 38 | 41 | ||
| Manufacturing | 1 | 1 | ||
| Merchants | 1 | 1 | ||
| Food and beverage | 1 | 1 | ||
| Steel | 3 | 10 | ||
| Total | 100 | 100 | ||
Our climate change position statement contains details (see www.exxaro.com) on our approach to climate change mitigation and adaptation. The document also includes our scope 1 and 2 aspirational target of carbon neutrality by 2050. We have developed climate change scenarios that take into account the 2oC world as recommended by the TCFD. We will be using these scenarios to conduct a detailed analysis to quantify the financial risks and opportunities in our operations.
For 2020, real global economic growth is anticipated to take significant strain – a global recession now the base case – mainly as a result of the impact of the global spread of the coronavirus (COVID-19) pandemic.
We expect domestic thermal coal demand and pricing to remain relatively stable during 2020.
The API4 is expected to be under pressure as a similar liquefied natural gas (LNG) supply wave, as evident in 2019, is anticipated to continue into 2020, together with low gas prices globally.
South Africa's fiscal imbalance is set to remain a major constraint in addressing the increasing socio-economic challenges the rand/dollar exchange rate is expected to remain volatile.
As we roll out the integrated operations centres at all our business units, in terms of our digitalisation plan, increased visualisation of the mining value chain will highlight embedded inefficiencies that will be addressed through in-time decision making relating to safety, productivity and cost performance. At an enterprise level, we are on schedule to implement our integrated management platform allowing us to access strategic insights across our operations, enabling future looking value-add conversations.
The expected recovery in iron ore seaborne supply with narrowing steel margins will soften the iron ore market.
Our shareholding in Tronox Holdings plc has been reduced to approximately 14.7 million shares, representing about 10% of the total outstanding shares as at 31 December 2019. We remain committed to monetising our stake in Tronox Holdings plc over time and in the best possible manner, taking into account prevailing market conditions.
In 2017, Exxaro adopted a strategy to explore new investment opportunities based on three pillars: water security, food security and energy security. Based on our experience since then, we have now changed that strategy to focus solely on new opportunities in the energy security space. As we pursue these opportunities, our approach continues to be measured with a view to mitigating potential risks and ensuring that the capital allocation decisions are in line with the appropriate metrics.
With regard to the Moranbah South hard coking coal project, Exxaro, together with Anglo American Coal, is in the process of reassessing the potential development plan for the project.
Subsequent to year end and the finalisation of the financial statements, the COVID-19 (the virus) pandemic required us to support government protocols and directives to contain the spread of the virus. We have undertaken to act responsibly in preventing the further spread of the virus and therefore implemented our Crisis Management Plan (CMP) and Business Continuity Plan (BCP) across the breadth of our businesses, which includes health and safety controls and preventative measures.
Additionally, it is important to recognise the impact on the South African economy and the cumulative negative impact of the lockdown period, which commenced on midnight, 26 March 2020 and is foreseen to last until midnight, 16 April 2020. We have received the necessary approval to continue with our production activities during this period, albeit at varying reduced levels in terms of volumes and people, as these activities are considered to be essential services and the necessary measures have been taken to prevent possible infections. Refer to note 18.3 of the group and company annual financial statements for the year ended 31 December 2019 for more detail.
Riaan Koppeschaar
Finance director
20 April 2020