Integrated report 2019
Exxaro Resources Limited
Integrated report 2019

To illustrate value creation over time, Exxaro uses the six categories of capital identified by the IIRC: natural, human, social and relationship, manufactured, financial and intellectual.
 In all of our activities, we manage the capitals responsibly to ensure maximum benefit for all stakeholders, as outlined in our business model.
Adding value to each capital, and managing the trade-offs, supports our social licence to operate (understanding our strategic trade-off considerations).
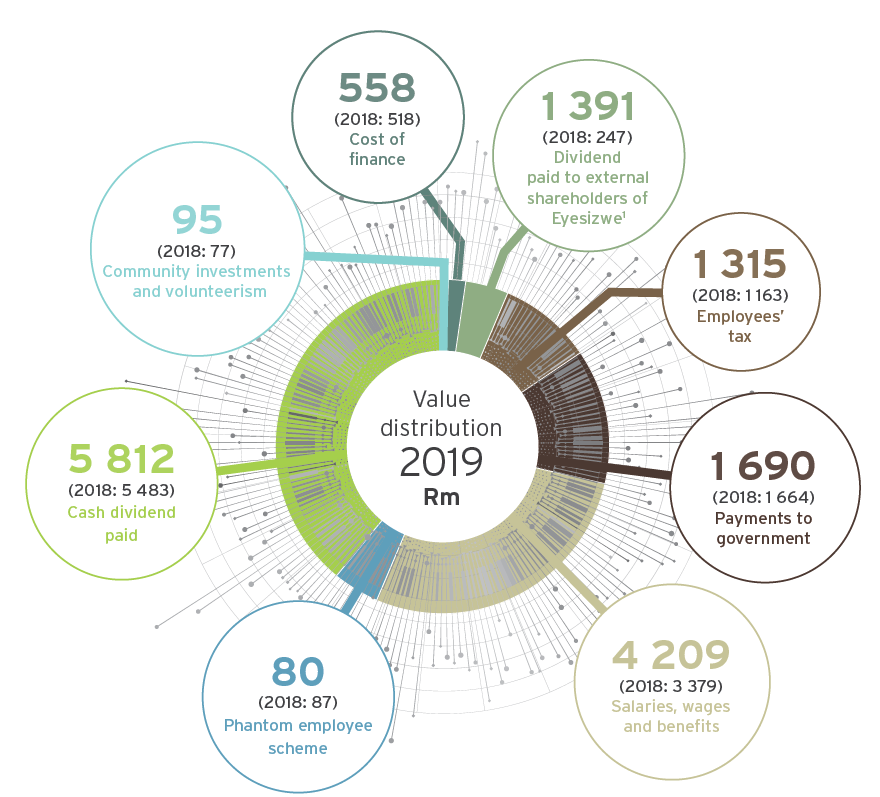
| 2019 | 2018 | |||
| 95 | Community investments and volunteerism | 77 | ||
| 1 391 | Dividend paid to external shareholders of Eyesizwe | 247 | ||
| 1 315 | Employees' tax | 1 163 | ||
| 1 690 | Payments to government: taxation contribution | 1 664 | ||
| 4 209 | Salaries, wages and benefits | 3 379 | ||
| 558 | Cost of finance | 518 | ||
| 5 812 | Cash dividend paid | 5 483 | ||
| 80 | Phantom employee scheme | 87 |
1 Eyesizwe (RF) Proprietary Limited.
| Natural capital | Trend | Target | 2019 | 2018 | 2017 |
| Reportable environmental incidents (levels 2 and 3) | ➔ |
0 | 0 x level 2 | 7 x level 2 | 1 x level 2 |
| Carbon intensity (scope 1) (kt CO2e) | ➔ |
Actual for previous year less 5% | 7% improvement |
12% improvement |
17.7% improvement |
| Carbon intensity (scope 2) (kt CO2e) | ➔ |
Actual for previous year less 5% | 2% improvement |
(0.01%) | 5% improvement |
| Water intensity (kL/run of mine) | ➔ |
0.20 | 0.10 | 0.11 | 0.18 |
| Rehabilitation funding adequacy of commercial mines, including guarantees (%) | ➔ |
80% to 100% | 68 | — | — |
R4.4 billion Our employees enjoy the largest share of value created from earnings as well as investments in development |
2 316 cps Shareholders receive a return on their investment through dividends |
| Human capital | |||||
| Fatalities | ➔ |
0 | 0 | 0 | 1 |
| Lost-time injury frequency rate (LTIFR) | ➔ |
0.11 | 0.12 | 0.12 | 0.12 |
| Occupational health incident frequency rate (OHIFR) | ➔ |
0.31 | 0.24 | 0.33 | 0.33 |
| Skills provision (% of appointment from within) | ➔ |
60.0 | 47.9 | 52.4 | 56.1 |
R15.6 billion Suppliers and contractors are supported by our procurement of consumables, services and capital goods |
R1.7 billion Governments of countries in which we operate and invest receive taxes and royalty payments |
| Social and relationship capital | |||||
| B-BBEE contribution level | ➔ |
1 | 2 | 5 | 6 |
| Black ownership (%) | ➔ |
30 | 30 | 30 | 30 |
| Social and labour plans (SLP) project delivery (time variance) (%) | ➔ |
0 | (11) | 12 | (15) |
| SLPs project delivery (cost variance) (%) | ➔ |
0 | (58) | (8) | (15) |
28% ROCE Providers of finance receive a return on their investment |
R170.7 million 30 enterprises were granted loans and grant funding |
| Manufactured capital | |||||
| Capital project delivery measure (time variance) (%) | ➔ |
0 | 5 (behind) | 0.1 (behind) | (0.17) (behind) |
| Capital project delivery measure (cost variance) (%) | ➔ |
0 | 3.1 (within budget) | 0 (on target) | 1.0 (saving) |
R5.8 billion We reinvest in the growth of our coal business: R2.2 billion sustaining capital and R3.6 billion expansion capital |
| Financial capital | |||||
| Core operating margin (%) | ➔ |
20 | 15 | 29 | 32 |
| Annualised return on capital employed (ROCE)1 (%) | ➔ |
>20 | 28 | 23 | 23 |
| Annual core HEPS2 (cents per share short term target) | ➔ |
— | 2 354 | 2 159 | 2 011 |
| Net debt to annualised EBITDA3 (times) | ➔ |
<1.5 | 1.0 | 0.6 | — |
| 1 | 2017 is restated ( |
| 2 | HEPS is headline earnings per share |
| 3 | EBITDA is net operating profit before interest, tax, depreciation, amortisation, impairment charges/reversals and net loss or gain on the disposal of assets and investments (including translation differences recycled to profit or loss). |