Exxaro Resource limited Report Selector 2018

Currently viewing Supplementary Report 2018

Currently viewing Supplementary Report 2018

Exxaro Resources Limited Supplementary Report
 |
 |
Highlights |
|
Seven (7) environmental licences (renewal and amendments) were granted |
|
No level 3 (significant) environmental incidents were recorded |
|
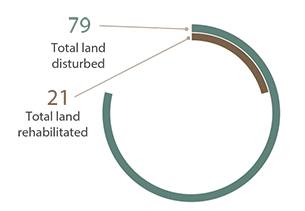
21% of the land disturbed is rehabilitated |
|
Maintained our CDP score of B+ |
|
Water and energy intensity targets are better than industry targets |
Lowlights |
|
Still recording level 2 incidents. Target is to have no level 2 and 3 incidents |
|
Some mines not on target in implementing alien and invasive species programmes |
|
Rehabilitation financial provisions for captive (Eskom) mines still a challenge |
|
Natural resources like water, air, biodiversity and land are central to our business. We focus on responsible use by conserving natural resources and reducing the burden of pollutants on the environment through:
Comprehensive group standards have enhanced the implementation of legal requirements and sustainable use of natural resources. These include management standards for air quality, water, energy, rehabilitation and mine closure, and environmental incident management and reporting. All Exxaro's business units have ISO 14001 accreditation, reflecting the global industry standards in place to minimise environmental impacts. All our South African operations have environmental management programmes (EMPs) as required under the Mineral and Petroleum Resources Development Act (MPRDA) and National Environmental Management Act (NEMA). These are key indicators in ensuring Exxaro remains a sustainable business. We also adopt the precautionary principle entrenched in NEMA in evaluating the environmental impacts of business opportunities. All our operations have now been granted integrated water use licences (most Exxaro business units need more than one licence). There were four new water use licences granted in 2018. |

| Energy | Water | Waste | ||
|
|
|
| Ecology | Closure and ongoing rehabilitation | Land management | Air | ||||
|
|
|
|
Building blocks to exceed compliance levels
After a strategic review of key environmental risks from Exxaro's operations, we have identified the building blocks required to ensure consistent compliance and, in time, to exceed regulatory minimums where possible.
South African mining companies are heavily regulated, with compliance centred on receiving, converting and retaining all mining rights. To ensure we continue to meet legal requirements as a minimum, compliance across Exxaro is monitored by two board-mandated entities: the sustainability, risk and compliance committee as well as the social and ethics committee.
Running all our operations with approved EMPs is fundamental to our sustainability and legal compliance. Some EMPs are being updated to align to the MPRDA and to include new developments. As applications for various projects are at different stages of regulatory assessment, we continuously engage with the relevant authorities, agencies and other stakeholders to expedite these licences.
Two new mining rights were granted and two new prospecting rights were granted.
Exxaro received no environmental stoppage directives in the review period. No fines were issued.
We completed the lengthy process of migrating our authorisations to the National Water Act (1998) two years ago. All Exxaro operations now have the required integrated water use licence.
Incident reporting
Using a standardised reporting system, all business units manage incidents effectively, resulting in a safer and more sustainable work environment. In 2018, seven level 2 incident occurred and was reported to the relevant authorities. Corrective actions to prevent recurrence were approved by authorities prior to implementation. There were no significant (level 3) incidents in 2018.
Environmental incidents – group
| Level 1 | Level 2 | Level 3 | ||||||||||
| Business unit | 2018 | 2017 | 2018 | 2017 | 2018 | 2017 | ||||||
| Arnot | – | 14 | – | – | – | – | ||||||
| Char plant | – | – | – | – | – | – | ||||||
| Durnacol | – | – | – | – | – | – | ||||||
| Grootegeluk | 11 | 16 | 1 | – | – | – | ||||||
| Hlobane | – | – | – | – | – | – | ||||||
| Leeuwpan | 8 | 20 | – | – | – | – | ||||||
| Matla | 19 | 29 | – | 1 | – | – | ||||||
| North Block Complex | 13 | 4 | 1 | – | – | – | ||||||
| ECC | 28 | 1 | – | – | – | – | ||||||
| Tshikondeni | 1 | 1 | – | – | – | – | ||||||
| Belfast | 50 | – | 5 | – | – | – | ||||||
| Total | 80 | 85 | 7 | 1 | 0 | 0 | ||||||
| Level 1: Minor impact and/or non-compliance. |
| Level 2: Intermediate impact and/or non-compliance. |
| Level 3: Major impact and/or non-compliance |
Environmental incidents – level 2
| Business unit | Description | Receiving environment | Response | |||
|
Belfast |
Excavator with hydraulic pipe burst. Oil spillage on both soil as well as water – ponding water collected in the excavation due to rain |
Soil |
|
|||
|
Encroachment on a wetland by the stockpiling of topsoil from berm clearing of road D1110 |
Wetland |
|||||
|
Blockage of the Klein-Komati River by temporary road towards the pit areas |
Water |
|||||
|
Additional tipping of topsoil on stockpile encroaching on a wetland adjacent to the D1110 |
Wetland |
|||||
|
Two graves covered by Dam 5 stockpile |
Soil |
|||||
|
NBC |
On the 21st of June 2018 an employee from SCM informed the sustainability department at 7:30 about a large diesel spillage at the diesel bay. The spillage was next to an abandoned Andru Diesel bowser which was suspected to have been abandoned after the spillage occurred. It is estimated +- 900 litres of diesel was spilt on bare soil |
Soil |
||||
|
GG |
Significant fire incident at reductants – plant shut down |
Air and soil |
As a mining group, air quality remains a risk to Exxaro on several levels, particularly dust and other pollutants such as particulate matter (PM) including PM10 and PM2.5 from open-cast operations. Accordingly, we focus on:
Air quality management initiatives
| Objectives | Critical success factors | What | When | Progress | ||||
|
Compliant, sustainable air quality management system, operated and controlled by trained specialists at business units |
Integrated air quality management planning in core operational processes |
Baseline assessments Impact assessments Optimise monitoring programme |
Third quarter 2019 |
Baseline assessments, impact assessments and ambient monitoring review completed in business units as part of group-wide air quality management initiative |
Long and short-term goals for air quality management
| Goals | Target | Progress | ||
|
Initiating PM10 and PM2.5 at our business units (operational and greenfield projects for baseline data) |
Third quarter 2019 |
Monitoring initiated as a priority in some business units and greenfield projects such as Belfast and Thabametsi |
||
|
Initiating PM10 and PM2.5 monitoring for all business units (operational and greenfield projects for baseline data) |
Fourth quarter 2019 |
Dust fallout networks redesigned in all business units and greenfield sites |
||
|
Meteorological monitoring to ensure availability of surface data for temperature, wind direction, wind speed, and more. This data will be used for dispersion modelling, baseline characterisation, ambient monitoring, including dust fallout monitoring and reporting, etc |
Fourth quarter 2019 |
Meteorological stations installed in business units such as Leeuwpan, Thabametsi and Belfast, with a commitment to purchase and install more in the remaining business units |
||
|
Ensuring compliance to air quality standards and guidelines in the country |
Ongoing |
Most business units currently monitor dust fallout and PM10. Results are assessed for compliance to national dust control regulations and ambient air quality standards for PM10 |
Open-cast mining generates dust (blasting, drilling, crushing and screening, vehicle convoys, materials handling and wind erosion of exposed operational areas). Daily mitigation measures include applying chemical dust suppressants on haul roads, watering secondary unpaved operational roads, vegetating topsoil stockpiles and overburden material.
All our mining operations monitor dust fallout rates and results are assessed against residential and non-residential limits in national dust control regulations. Although our operations are classified under the non-residential limit, some are close to residential areas or sensitive receptor areas. As such, we track our compliance against the more stringent residential limit (600mg/m2/day) instead of the non-residential limit (1 200mg/m2/day) to minimise the impact on residents.
We continue to concentrate on improving our mitigation measures for operational activities that contribute significantly to dust. This will reduce dust impacts on sensitive receptors and ensure compliance.
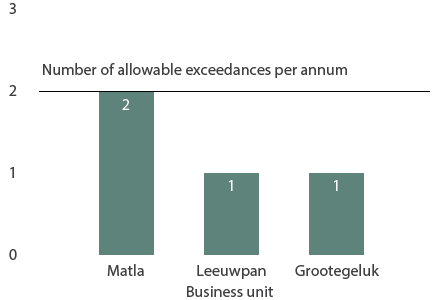
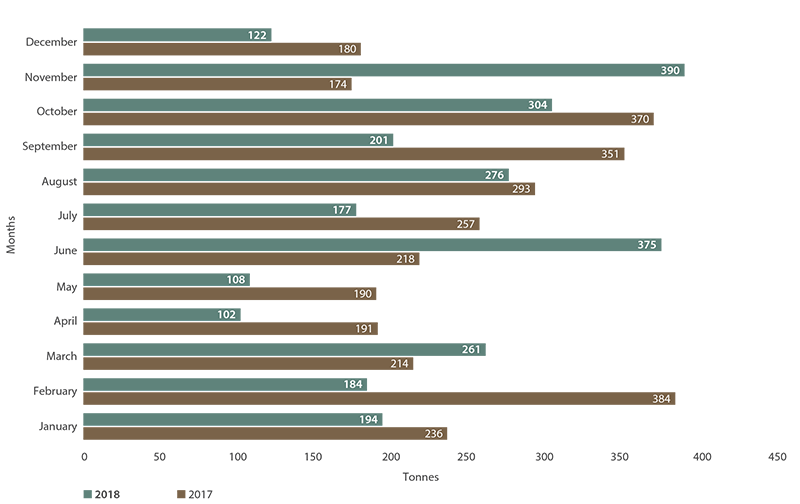
Comparing Exxaro's dust fallout rate in 2018 against the regulated residential and non-residential limit, all operations were within allowable annual limits.
Dust fallout – 2018
| Target | 2018 | 2017 | 2016 | 2015 | 2014 | 2013 | 2012 | ||
| Coal: 300mg/m2/day | 184 | 172 | 169 | 173 | 335 | 351 | 480 |
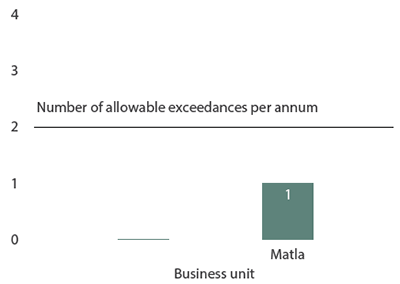
| Number of exceedances of the residential limit (January to December 2018) (Number of exceedances) |
Number of exceedances of the non-residential limit (January to December 2018) (Number of exceedances) |
|
 |
 |
|
Definitions and context Scope 1: Direct greenhouse gas (GHG) emissions, measured in tonnes of carbon dioxide equivalent (tCO2e) from sources owned or controlled by Exxaro, eg emissions from diesel, petrol, gas and anthracite combusted in day-to-day mining operations. Scope 2: GHG emissions from electricity generation by Eskom, purchased by Exxaro. Scope 3: Emissions outside our control but emanating from our products or activities, eg customer burning coal sold by Exxaro. The scope 1, 2 and 3 emission protocol provides a common measurement platform to compare firms, aggregate data to national level and compare countries. South Africa has set arguably the most aggressive carbon abatement targets of any developing country: to reduce emissions by 34% below business as usual by 2020, and 42% by 2025. |
Carbon footprint
Operational activities are guided by our climate-change response strategy. A steering committee oversees related improvement projects and activities, and ensures these are aligned with Exxaro's stance on climate change.
This supports a clear understanding of the risks and opportunities presented by energy and emissions in the broader sense, and enables operations to focus on managing energy, emissions and other climate change-related issues.
Our energy and carbon measurement, data management, accounting and reporting is maturing. Exxaro reports carbon emissions through CDP South Africa (the local arm of the international benchmark carbon and water disclosure projects), where we continuously report on scope 1, 2 and 3 emissions.
We base our accounting and reporting for GHG emissions on the Greenhouse Gas Protocol (www.exxaro.com) and have elected to use the operating control accounting approach for emissions.
GHG emissions
Arrows indicate movement from 2017
| ktCO2e | 2018 | 2017 | 2016 | 2015 | 2014 | 2013 | |
| Scope 1 | ↓ 315 | 324.9 | 323 | 235.2 | 229.8 | 236 | |
| Scope 2* | ↑ 552 | 539 | 501 | 521.9 | 557.6 | 525 | |
| Total scope 1 and 2 | ↑ 867 | 864 | 824 | 757.1 | 787.4 | 761 | |
| Year-on-year change (%) | 0.4 | 4.9 | 8.8 | (3.8) | 3.5 | (48) | |
| Scope 3** | ↓ 72 928 | 76 462 | 71 697 | 73 847 | 74 768 | 69 737 | |
| Year-on-year change (%) | 4.6 | 2.7 | (2.9) | (1.2) | 7.2 | (1.3) |
| *Scope 2: Electricity-based emissions are derived from the grid emission factor for South Africa (0.97tCO2e/MWh). |
| **Scope 3: Reported emissions based on use of product sold by Exxaro. Reported emissions represent over 95% of Exxaro's scope 3 emissions. |
Carbon emissions by source
Arrows indicate movement from 2017
| ktCO2e | 2018 | 2017 | 2016 | 2015 | 2014 | 2013 | |
| Electricity | ↑ 552 | 539 | 501 | 521.9 | 557.6 | 525.3 | |
| Year-on-year change (%) | 2.4 | 7.5 | (4) | (6.8) | 6.1 | 1.2 | |
| Source proportion (%) | 64 | 62 | 66.5 | 68.9 | 70.7 | 68.8 | |
| Diesel | ↑ 217.5 | 211.3 | 168.2 | 174.8 | 155.9 | 157.8 | |
| Year-on-year change (%) | 2.9 | 25 | (3) | 10.8 | (1.2) | (4.2) | |
| Source proportion (%) | 25 | 24 | 22.1 | 23.1 | 20 | 20.8 | |
| Fugitive emissions | ↓ 93 | 94.6 | 84.9 | 56.6 | 67.6 | 77.9 | |
| Year-on-year change (%) | 1.7 | 11 | 50 | (19.4) | (5.8) | (7.8) | |
| Source proportion (%) | 11 | 11 | 11 | 7.5 | 8.6 | 9.4 | |
| Other sources | ↓ 0.3 | 18.6 | 3.7 | 3.7 | 6.2 | 2.4 | |
| Year-on-year change (%) | 74 | 80 | 1 | (40) | 6.9 | 147.3 | |
| Source proportion (%) | 0.6 | 3 | 0.5 | 0.5 | 0.8 | 0.8 |
|
Carbon disclosure The CDP is a UK-based global climate change reporting system. This data provides valuable insights into corporate strategies and helps channel investment to companies adhering to sustainable carbon and emissions management. Exxaro participates in two programmes: CDP Climate Change (since 2008) and CDP Water (since 2010). To facilitate our reporting under the climate change programme, we manage a central data repository that records energy consumption, energy intensity performance, carbon emissions measurement and cost performance in each business unit and the group. This database is externally audited and assured each year. |
We remain focused on reducing Exxaro's carbon footprint in line with our commitment to reduce energy consumption and improve energy efficiency. Given the fast-changing legislative environment and promulgation of carbon tax from 1 June 2019, reducing GHGs is a business imperative as it could affect our financial performance.
2018 total GHG emissions by scope (tCO2e)
Arrows indicate movement from 2017
| Business unit | Scope 1 | Scope 2 | Scope 3 | Total |
| Arnot | ↓ 2 952.5 | 21 379.9 | 0 | 24 332.4 |
| Durnacol* | ↓ 100.6 | 104 | 0 | 204.6 |
| Grootegeluk | ↑ 164 589.4 | 370 036 | 50 349 047.3 | 50 883 673 |
| Hlobane* | ↓ 119 | 15.6 | 0 | 134.5 |
| Leeuwpan | ↑ 70 968 | 25 438.3 | 5 316 926 | 5 413 332 |
| Mafube | ↓ 16 082.5 | 15 446.2 | 1 923.4 | 1 954 954.9 |
| Matla | ↓ 35 929.5 | 102 585 | 11 995 701.8 | 12 134 216 |
| North Block Complex | ↓ 24 370.8 | 5 820.1 | 3 261 523.4 | 3 291 714 |
| Reductants | ↓ 151.7 | 0 | 81 322.8 | 81 474.4 |
| Tshikondeni* | ↓ 43.9 | 1 503.6 | 0 | 1 547.5 |
| AlloyStream** | 0 | 0 | 0 | 0 |
| Corporate centre | ↓ 1.4 | 992 | 0 | 993.4 |
| FerroAlloys | ↑ 103.12 | 8 736.3 | 0 | 8 839.4 |
| R&D** | 0 | 0 | 0 |
| *Operations in closure. |
| **Closed operations. |
Diesel and electricity are the primary sources of energy for all our business units, at 59% and 41% respectively.
Total energy consumed rose 8% in 2018 to 4 977 270 gigajoules (GJ). The increase in diesel consumption is due to concurrent rehabilitation at operating mines and higher production at Grootegeluk and Leeuwpan. For Grootegeluk and Leeuwpan, the increase in production or change in mining has a direct impact on diesel and electricity consumption.
As part of Exxaro's energy and carbon management programme, our coal operations have focused on reducing energy consumption, including projects to specifically increase the efficiency of diesel and electricity consumption. The head office technology and engineering departments initiated projects to reduce diesel consumption at all our operations, including the use of fuel additives and payload management. Future projects include developing a consolidated dashboard for fuel and electricity in various business units.
We believe all these initiatives will support the transition of our operations to greater energy efficiency, characterised by low carbon footprints and optimised energy consumption.
To facilitate energy-saving initiatives, energy-intensity targets are set annually based on the prior two-year performance for each operation and monitored monthly. These targets were reviewed at the end of 2017 and long-term (five years) targets proposed. These will be implemented in the second half of 2019.
Although electricity and diesel consumption increased in 2018, electricity and diesel intensities declined, proving we are working more efficiently. Based on production tonnes in 2018, electricity intensity of 12.9MWh/kt declined 6% from 2017, while diesel intensity of 1 592l/kt was down 4%.
Electricity consumption in coal operations – 2018
| Electricity (MWh) | Production (kt) | Electricity intensity (MWh/kt) | |||||||||||||||
| 2018 | 2017 | 2016 | 2015 | 2018 | 2017 | 2016 | 2015 | 2018 | 2017 | 2016 | 2015 | ||||||
| Coal | 543 178 | 527 688 | 518 376 | 566 521 | 41 952 | 39 312 | 37 030 | 40 969 | 12.95 | 13.83 | 12.86 | 13.83 | |||||
| Change (%) | 3 | 1.8 | (6) | (3.2) | 6 | 6 | (10) | 7 | 7.5 | 1 | (13) | ||||||
| Arnot | 22 041 | 26 967 | 29 394 | 49 742 | – | – | – | 1 401 | – | – | – | 35.5 | |||||
| Reductants | – | – | – | – | – | 86 | 54 | 48 | – | – | – | – | |||||
| Durnacol | 107 | 99 | 114 | 139 | – | – | – | – | – | – | – | – | |||||
| Grootegeluk | 381 480 | 358 101 | 335 041 | 341 932 | 29 698 | 25 538 | 22 601 | 25 554 | 12.85 | 14.02 | 14.8 | 13.4 | |||||
| Hlobane | 16 | 21 | 20 | 19 | – | – | – | – | – | – | – | – | |||||
| Leeuwpan | 26 225 | 25 242 | 25 951 | 27 037 | 4 220 | 3 355 | 3 774 | 2 202 | 6.21 | 7.52 | 6.9 | 12.3 | |||||
| Matla | 105 757 | 107 467 | 109 710 | 108 185 | 6 609 | 7 400 | 7 900 | 7 858 | 16 | 14.52 | 13.9 | 13.8 | |||||
| North Block Complex | 6 000 | 7 757 | 6 791 | 7 860 | 1 425 | 2 665 | 2 701 | 2 871 | 4.21 | 2.9 | 2.4 | 2.7 | |||||
| Tshikondeni | 1 550 | 2 034 | 2 747 | 4 538 | – | – | – | – | – | – | – | – | |||||
Diesel consumption in coal operations for 2018
| Diesel (kl) | Production (kt) | Diesel consumption intensity (l/kt) | |||||||||||||||
| 2018 | 2017 | 2016 | 2015 | 2018 | 2017 | 2016 | 2015 | 2018 | 2017 | 2016 | 2015 | ||||||
| Coal | 73 926 | 72 101 | 65 052 | 64 520 | 41 952 | 39 312 | 37 030 | 40 969 | 1 762 | 1 655 | 1 756 | 1 574 | |||||
| Change (%) | 1 | 10.8 | 1 | 10.9 | 6 | 6 | (10) | – | 6 | (5.8) | 11.6 | 1.7 | |||||
| Arnot | 989 | 1 311 | 1 243 | 1 043 | – | – | – | 1 401 | – | – | – | 744 | |||||
| Reductants | 118 | 79 | 55 | 142 | – | 56 | 54 | 48 | – | 1 411 | 1 019 | 2 897 | |||||
| Durnacol | 27 | 25 | 38 | 43 | – | – | – | – | – | – | – | – | |||||
| Grootegeluk | 41 940 | 40 846 | 30 231 | 35 521 | 29 697 | 25 538 | 22 601 | 25 554 | 1 412 | 1 599 | 1 338 | 1 390 | |||||
| Hlobane | 33 | 40 | 39 | 36 | – | – | – | – | – | – | – | – | |||||
| Leeuwpan | 16 625 | 16 768 | 16 371 | 17 043 | 4 220 | 3 355 | 3 774 | 2 202 | 4 618 | 4 998 | 4 337 | 7 736 | |||||
| Matla | 2 503 | 2 550 | 3 071 | 2 677 | 6 609 | 7 400 | 7 900 | 7 859 | 379 | 345 | 389 | 341 | |||||
| North Block Complex | 8 609 | 10 462 | 9 867 | 8 121 | 1 425 | 2 962 | 2 701 | 2 871 | 6 041 | 3 956 | 3 653 | 2 828 | |||||
| Tshikondeni | 8 | 22 | 35 | 134 | – | – | – | – | – | – | – | – | |||||
Water is a strategic natural resource for South Africa and key to our business. The Exxaro water management policy defines our commitment to its sustainable use, with a strong focus on efficiency through reuse and recycling. This policy is aligned to the legislative environmental framework governed mainly by the National Water Act 36 1998. In support of the act, the Department of Water and Sanitation (DWS) has issued an integrated water resource management hierarchy that prioritises mine and waste management decisions and actions.
This hierarchy informs both our policy and strategy on mine and waste water management as:
Translating policy into action, our management standard on water for mining and industrial use articulates our commitment to develop and implement an effective integrated water and waste management plan across the lifecycle of a mine. This includes planning, construction, operation, decommissioning, closure and rehabilitation phases. The standard reflects management's vision to:
These management standards adhere to DWS best-practice guidelines on:
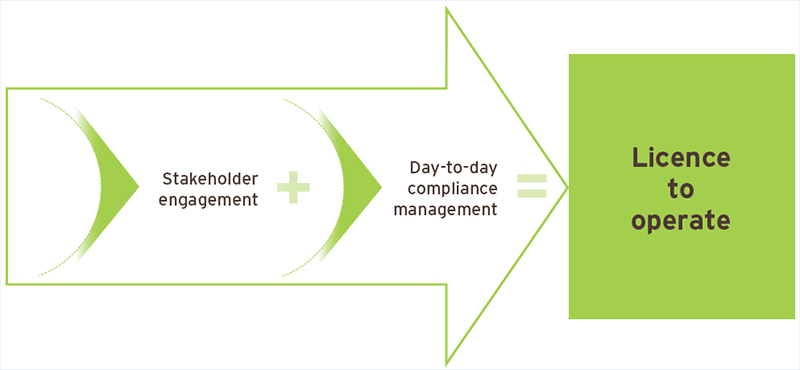
Water management is integral to our licence to operate. The group water strategy was approved in 2017, aiming for excellence in the following focus areas:
A comprehensive programme is entrenching responsible and sustainable water management across Exxaro. It concentrates on relevant water-use and related risks – from security of supply to water efficiency and water-cost management – and manages these within current and anticipated regulatory compliance requirements. This is supported by continually enhancing our competence in water-management issues through company-wide research and skills development. We also reinforce awareness of water issues through ongoing communication and training.
We are managing water-related risks, minimising impacts, and operating efficiently through reduction, reuse and recycling. Most of our operations have water-conservation plans that support the national strategy to ensure equitable distribution of water resources that allows for business growth and protection (sustainable use).
We are also committed to protecting and improving the overall water quality by discharging treated water back into the system. Central to this are the two reverse-osmosis water-treatment plants in our Mpumalanga region as part of our long-term water management strategy. These plants have total capacity to treat 11.5 megalitres per day. The plant at Matla has been operational for three years while the plant at North Block Complex has been operational for two years.
We continue to collaborate with other mining houses and universities through the Coaltech research initiative. These research projects provide much-needed guidelines on sustainable mine-water management and mine closure. This will ultimately enhance the sustainable use of our water resources and final land-use planning.
The formation of the Mine Water Coordinating Body (MWCB) last year further strengthens our public-private collaboration by providing a platform to align our mine-water management plans with the national water resource strategy (NWRS2) and to investigate regional solutions in the Olifants River catchment of Mpumalanga.
Water-use monitoring and measurement
We maintain a centralised database on water consumption. Our water accounting methodology includes measuring water volumes and quality against efficiency and intensity targets, water-use permit conditions and internal benchmarks and trends. Our data also correlates to the reporting format of the annual submission to the CDP-Water.
The focus in 2018 was on setting site-specific targets for water intensity over a five-year period (to 2022), where water intensity is defined as total water withdrawals (excluding supply to third parties) from a resource (not recycled/reclaimed water) divided by run-of-mine (ROM), and is expressed as:
| Water intensity = | water withdrawals (m3) |
| ROM (tons) |
Water intensity performance
Through water-conservation measures and raised awareness, all operations have reached the five-year target, except for North Block Complex's Glisa and Eerstelingsfontein mines. Exxaro reduced water withdrawals from Mokolo dam at Grootegeluk by increasing use of stored pit water in its processes as a temporary measure to reduce pit water levels.
Water-withdrawal performance
| Business unit | Water sources | Target(ℓ/t) 2022 |
Water intensity (ℓ/t) 2018 |
Water withdrawals(kℓ) 2018 | ||
| Coal | 200 | 109 | 8 683 275 | |||
| ECC Forzando North and South | Rain, external supplier | 151 | 135 | 434 315 | ||
| ECC Dorstfontein East | Rain, external supplier | 360 | 249 | 444 056 | ||
| ECC Dorstfontein West | Rain, municipal supply | 134 | 98 | 99 172 | ||
| Grootegeluk | Rain, Mokolo dam | 115 | 91 | 5 187 375 | ||
| Leeuwpan | Rain, boreholes | 92 | 55 | 363 694 | ||
| Matla | Eskom supply | 215 | 181 | 1 197 247 | ||
| North Block Complex: Glisa and Eerstelingsfontein | Rain | 219 | 413 | 709 367* |
| *Due to the sale, data included up to September 2018 |
Waste management is a key compliance indicator in Exxaro's social licence to operate. Our group standard enforces use of the waste management hierarchy, which in turn promotes waste prevention or minimisation, reuse, recycling, recovering energy and ensuring safe disposal of waste in line with the National Environmental Management: Waste Act 59 2008 and supporting legislation.
The total weight of hazardous waste generated at our managed coal operations in 2018 dropped 14% to 2 616 tonnes (2017: 3 058 tonnes).
| 2017 versus 2018 Q4 hazardous waste movement |
 |
Exxaro has submitted the Grootegeluk abatement plans for waste-tyre stockpiles as per requirements issued by the Department of Environmental Affairs (effective date: September 2017).
Biodiversity means species diversity and species richness in an ecological environment. In Exxaro, our goal is to conserve biodiversity for future generations by sustainably using the resources of our mining operations and South Africa's natural resources.
To reach this goal, we have developed biodiversity action plans for our business units. The guiding principles include the best-practice standard on wetland offsets (Wetland Offsets: A Best Practical Guideline for South Africa 2014), as well as the mining and biodiversity guideline (Mainstreaming biodiversity into the mining sector. DEA, DMR, Minerals Council, SA Mining and Biodiversity Forum and SANBI, 2013).
An investment was made in 2018 on wetland rehabilitation and on biodiversity management, including wetland offsets, delineation and wetland studies, as well as biomonitoring.
In addition to complying with legislation and best practice, we aim to develop a competitive advantage through conservation and re-establishing resilient ecosystems that underscore our commitment to duty-of-care principles.
The principles of these guidelines are already incorporated into our planning and execution phases. As example, the principles of best-practice standard were used in several projects to avoid constructing infrastructure in a sensitive wetland area.
Our detailed management standard guides business units in developing infrastructure, aiming to:
Exxaro has evaluated and identified all protected vegetation units with important conservation targets and listed as protected by the national spatial biodiversity assessment report.
Exxaro also references the mining and biodiversity guideline (M&BG, 2013), the Mpumalanga biodiversity sector plan (2014), and the national freshwater ecosystem priority areas (NFEPA 2011) guidelines during proposed expansion and new projects. Information from these guidelines is considered during desktop ecological and wetland studies and includes detailed site-specific assessments to confirm the accuracy of the guidelines.
Any negative impact on biodiversity reduces the ability of communities to gather biological resources, produce biomass, decompose and recycle essential nutrients. There is increasing evidence that biodiversity increases the stability of ecosystem functions through time.
Climate change is also a major threat to global biodiversity: rising atmospheric carbon dioxide and therefore temperatures will affect species ranges, seasonal growth cycles and weather. Major extinctions are predicted as climate change drastically alters the biology of many species.
Internal annual updates
All business units annually review their financial provisions. They also consider amendments to rehabilitation plans and closure objectives based on regular EMP performance assessments.
The cost estimates of activities in the concurrent and final-closure rehabilitation programme are reviewed and adjusted where necessary. The provisions are audited biannually by Exxaro's external auditors through physical site visits and document reviews.
The financial provisioning regulations (GNR 1147) were published in December 2015. In September 2018, the department published an amendment that extended the transitional period to February 2020. Exxaro appointed external consultants at all operations to complete reports and calculations as required by GNR 1147. These reports will be finalised in 2019 for submission in 2020.
Annual process
Concurrent rehabilitation plans
All business units have a five-year concurrent rehabilitation schedule and associated budget:
| Land disturbed versus land rehabilitated (ha) | Land disturbed versus rehabilitated (ha) | |
 |
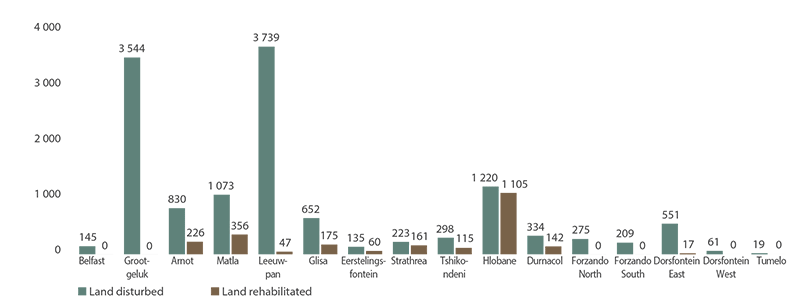 |
Liabilities
At 31 December 2018, total land disturbed was 9 559ha and total rehabilitated 2 469ha. The Exxaro Environmental Rehabilitation Fund (EERF) and ECC trust fund provide for a portion of these liabilities, while additional bank guarantees are taken out to provide for new developments and cover any shortfalls in financial provisions. The EERF's assets are managed in an asset-and-liability modelling process that aligns the risk/return profile of the assets to the liability profile of the mines. This is done at site level, leading to each site having a specific allocation to the different asset profiles. The objective is to maximise the contribution of investment growth to the overall cost of funding for the liability provisions. An external specialist supports EERF trustees with the technical skills required for profiling and in identifying suitable structures for assessment by the trustees. Current implementation includes:
Quarterly contributions to the trust are based on closure cost estimates at life of mine without considering any guarantees in place.
The trust funds earned R146 million in 2018, including cash contributions, interest earned on investments and fair-value adjustments. The fund has recorded 9% growth from an opening balance of R1 636 million in January 2018 to R1 782 million in December 2018. In addition, the group had bank guarantees of R2 971 million in place at year end. Updating these provisions biannually highlights potential rehabilitation alternatives that could decrease the long-term closure liabilities of mines.
Estimated closure costs per mine
The quantum for environmental contributions is calculated, based on relevant legislation, by both internal and external specialists:
| Mines as per AFS at 31 December 2018 |
DMR office | Estimated immediate closure cost Rm |
Estimated residual liability Rm |
Trust fund balance Rm |
Guarantee Rm |
Immediate shortfall to be covered over remaining life of mine Rm |
Remaining life (years) | ||
| Grootegeluk mine (including reductants area) | Limpopo | 3 168 | 211 | 486 | 1 226 | 1 667 | 45 | ||
| Thabametsi | Limpopo | 885 | (885) | 45 | |||||
| Paardeplaats | Mpumalanga | 88 | (88) | – | |||||
| Belfast | Mpumalanga | 37 | 2 | 133 | (94) | 18 | |||
| Leeuwpan MR 157 and 171 | Mpumalanga | 548 | 11 | 87 | 277 | 195 | 17 | ||
| Dorstfontein East | Mpumalanga | 675 | 83 | 117 | 641 | 8 | |||
| Dorstfontein West | Mpumalanga | 85 | 165 | 87 | 55 | 107 | 14 | ||
| Forzando North | Mpumalanga | 54 | 88 | 75 | 67 | 7 | |||
| Forzando South | Mpumalanga | 154 | 16 | 59 | 59 | 52 | 24 | ||
| Tumelo | Mpumalanga | 9 | 1 | 12 | 3 | (6) | – | ||
| Operational mines | 4 729 | 577 | 924 | 2 726 | 1 656 | ||||
| Arnot | Mpumalanga | 1 123 | 745 | 268 | 28 | 1 573 | – | ||
| Matla | Mpumalanga | 334 | 47 | 81 | 130 | 171 | 21 | ||
| Eskom tied mines | 1 457 | 792 | 348 | 158 | 1 743 | ||||
| Durnacol | KZN | 100 | 6 | 106 | – | ||||
| Hlobane | KZN | 44 | 51 | 95 | – | ||||
| Tshikondeni | Limpopo | 48 | 28 | 174 | 49 | (147) | – | ||
| Inyanda | Mpumalanga | 5 | 5 | – | |||||
| Glisa | Mpumalanga | 216 | (216) | – | |||||
| Strathrae | Mpumalanga | 27 | 68 | 90 | 5 | – | |||
| Eerstelingsfontein | Mpumalanga | 3 | (3) | – | |||||
| Newcastle | KZN | 0 | 2 | 2 | – | ||||
| Gravelotte | Limpopo | 2 | 35 | (33) | – | ||||
| HQ – inactive sites | 36 | 10 | 30 | 15 | – | ||||
| Closed operations | 262 | 165 | 510 | 87 | (170) | ||||
| Total Exxaro | 6 338 | 1 533 | 1 782 | 2 971 | 3 229 |
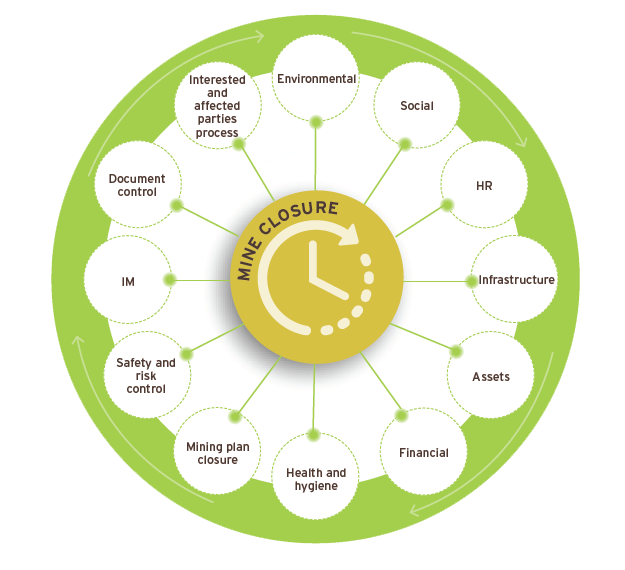
Mine closure
Exxaro had six operations in active closure in 2018 – Arnot, Tshikondeni, Durnacol, Hlobane, Strathrae and Gravelotte. Understanding that operational closure, concurrent rehabilitation and land management activities directly link employees, community, environment, government and infrastructure, we are committed to:
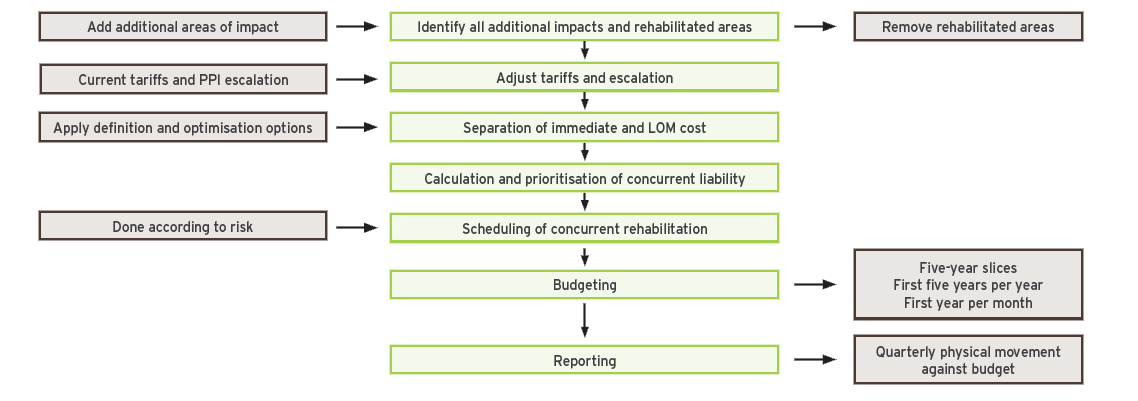
Our closure-planning process is illustrated below:
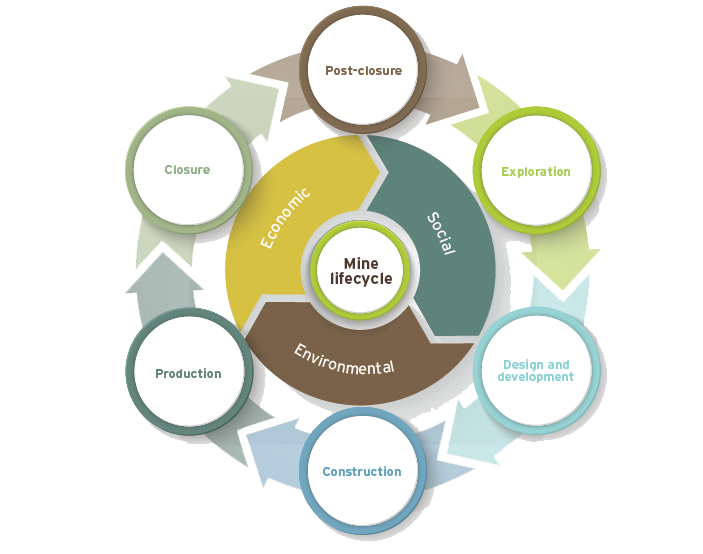
Integrating stages of mining and mine-closure planning
Operational closure, concurrent rehabilitation and managing the land where our operations are currently located is part of our operating philosophy and moral responsibility. We actively plan our operations with closure in mind and ensure we have adequate financial resources to meet our rehabilitation commitments.
We strive to integrate land, rehabilitation and liability management in day-to-day mine planning, aiming to minimise final closure costs for each operation and optimise final land use after closure.
Social closure principles
While most closure planning relates to technical or engineering issues and the associated financial planning, social aspects are the most important part of mine closure. This includes aspects such as:
Please refer to our comprehensive mineral resources and reserves report on our website.