Exxaro Resource limited Report Selector 2018
Currently viewing Annual Financial Report 2018
Currently viewing Annual Financial Report 2018

Exxaro Resources Limited Group and company annual financial statements
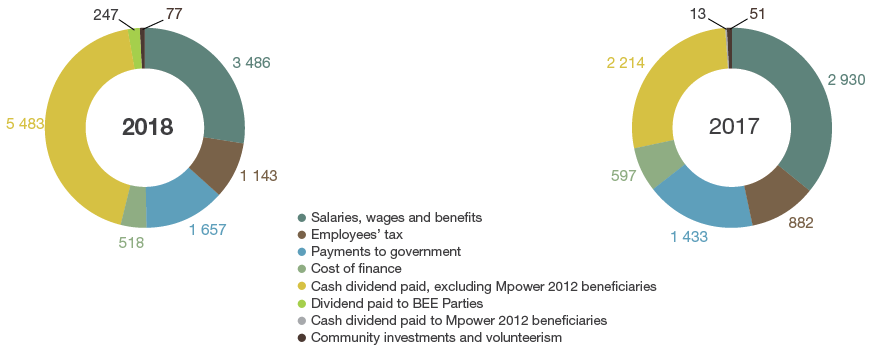
The cash value added statement shows the wealth the group has created through mining operations and investing activities.
Exxaro generates and creates value to its various stakeholders as follows:
The statement on page 7 summarises the total cash wealth created and how it was disbursed among the group’s stakeholders. The retained amount was reinvested into the group for the replacement of assets and further development of operations (further value add over time).
| Value distribution |
 |
| For the year ended 31 December | 2018 Rm |
2017 Rm |
||||
| Direct economic value generated | 14 546 | 13 020 | ||||
|---|---|---|---|---|---|---|
| Gross revenue from the sale of products and services (including VAT) | 29 025 | 25 855 | ||||
| Income from investments and interest received | 2 932 | 1 688 | ||||
| Operating costs | (17 411) | (14 523) | ||||
| Economic value distributed | (12 611) | (8 120) | ||||
| Employee salaries, wages and benefits (excluding PAYE) | (3 486) | (2 930) | ||||
| PAYE deducted from remuneration paid | (1 143) | (882) | ||||
| Payments to government (taxation contribution) | (1 657) | (1 433) | ||||
| Cost of financing (interest paid and other loan costs) | (518) | (597) | ||||
| Cash dividend paid, excluding Mpower 2012 beneficiaries | (5 483) | (2 214) | ||||
| Cash dividend paid to Mpower 2012 beneficiaries | (13) | |||||
| Dividend paid to BEE Parties | (247) | |||||
| Community investments and volunteerism (including donations) | (77) | (51) | ||||
| Net economic value retained in the group to maintain and develop operations | 1 935 | 4 900 | ||||
| Included in the above are: | ||||||
| Payments to government (taxation contribution) | (1 657) | (1 433) | ||||
| Direct taxes per country (excluding deferred tax) | (1 007) | (790) | ||||
| – RSA | (986) | (774) | ||||
| – Netherlands | (21) | (16) | ||||
| VAT | (153) | (434) | ||||
| – Levied on purchases of goods and services | 2 992 | 2 254 | ||||
| – Charged on turnover | (3 145) | (2 688) | ||||
| Additional amounts collected by the group on behalf of government | ||||||
| – Unemployment Insurance Fund | (12) | (12) | ||||
| Levies paid to government | (485) | (197) | ||||
| – Rates and taxes | (6) | (10) | ||||
| – Royalties | (413) | (133) | ||||
| – Workers' Compensation Fund | (13) | (7) | ||||
| – Unemployment Insurance Fund | (12) | (12) | ||||
| – Skills Development Levy | (41) | (35) | ||||
| Community investments and volunteerism per region | (77) | (51) | ||||
| – Gauteng | (34) | (19) | ||||
| – Limpopo | (23) | (15) | ||||
| – Mpumalanga | (20) | (17) | ||||