Exxaro Resource limited Report Selector 2018


Currently viewing Mineral Resources Report 2018
Currently viewing Mineral Resources Report 2018

Exxaro Resources Limited Mineral Resources Report
This document indicates Exxaro's Coal Resources and Coal Reserves remaining as at 31 December 2018. Mineral Resource and Mineral Reserve figures are not an inventory of all mineral occurrences drilled or sampled, but a realistic record of those which, under assumed and justifiable technical and economic conditions, may be economically extractable currently and in future.
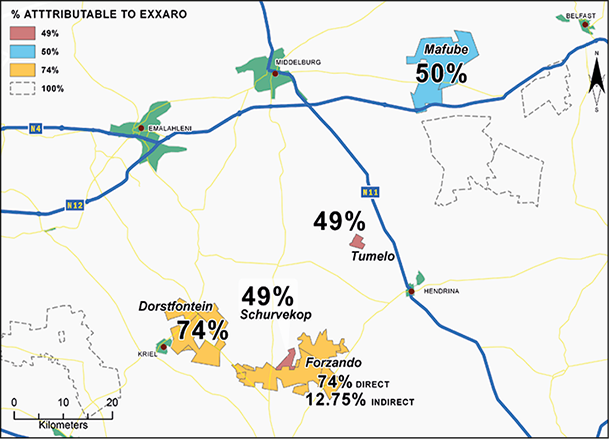
| Figure 9: Coal joint-venture operations in Mpumalanga province |
 |
Mineral Resources and Mineral Reserves are reported inclusive of Mineral Resources that have been converted to Mineral Reserves. An exception is reporting for Gamsberg and Black Mountain Mining, because figures received from Vedanta plc (JORC Code) represent Mineral Resources excluding Mineral Reserves.
Exxaro includes all estimates directly under its management control and estimates of entities in which Exxaro holds a 25% interest or larger. Mineral resources and Mineral Reserves are reported at 100%, irrespective of the percentage attributable to Exxaro.
The percentage attributable tonnage (only coal) can be deduced from the attributable ownership (figure 9) stated in the Coal Resources and Coal Reserves tables and the summarised tonnages are shown in table 3. Explanations for material changes are provided as footnotes in the Coal Resources and Coal Reserves tables and detailed explanations for year-on-year movements are provided.
Table 3: Attributable Coal Resource and Coal Reserve tonnages |
||||
| Commodity - Coal | 2018 MTIS (Mt) |
|||
| Exxaro attributable tonnes | Measured | 4 720 | ||
|---|---|---|---|---|
| Indicated | 2 227 | |||
| Inferred | 6 970 | |||
| Total resources | 13 918 | |||
| Proved | 3 030 | |||
| Probable | 763 | |||
| Total reserves | 3 793 |
Table below details the total inclusive Coal Resources estimated as at 31 December 2018.
Table 4: Coal Resources and qualities for 2018
| 2018 - tonnes and grade4 | 2017 - tonnes and grade4 | ||||||||||||||||
| Operation1 | Location3 | Resource category | Tonnes (Mt) |
CV MJ/kg |
% Ash |
% IM |
% VM |
% S |
Tonnes (Mt) |
CV MJ/kg |
% Ash |
% IM |
% S |
% change in tonnes5 |
|||
| Arnot mine6 |  |
Measured | 20.2 | 24.2 | 26.6 | 4.0 | 1.0 | 20.2 | 24.2 | 26.6 | 4.0 | 1.0 | 0 | ||||
|---|---|---|---|---|---|---|---|---|---|---|---|---|---|---|---|---|---|
| (OC) | Indicated | 18.9 | 24.5 | 26.7 | 3.8 | 0.9 | 18.9 | 24.5 | 26.7 | 3.8 | 0.9 | 0 | |||||
| (in closure) | Inferred | 8.8 | 24.0 | 26.7 | 3.9 | 0.8 | 8.8 | 24.0 | 26.7 | 3.9 | 0.8 | 0 | |||||
| Mpumalanga | Total | 47.9 | 24.3 | 26.7 | 3.9 | 1.0 | 47.9 | 24.3 | 26.7 | 3.9 | 1.0 | 0 | |||||
| 100% attributable to Exxaro2 | Resources inside life-of-mine plan5 (LoMP) | ||||||||||||||||
| Arnot mine6 | |
Measured | 118.3 | 23.6 | 22.0 | 4.0 | 1.0 | 118.3 | 23.6 | 22.0 | 4.0 | 1.0 | 0 | ||||
| (UG) | Indicated | 45.4 | 23.4 | 22.6 | 4.2 | 0.9 | 45.4 | 23.4 | 22.6 | 4.2 | 0.9 | 0 | |||||
| (in closure) | Inferred | 12.5 | 23.8 | 21.4 | 4.3 | 0.9 | 12.5 | 23.8 | 21.4 | 4.3 | 0.9 | 0 | |||||
| Mpumalanga | Total | 176.2 | 23.5 | 22.1 | 4.1 | 1.0 | 176.2 | 23.5 | 22.1 | 4.1 | 1.0 | 0 | |||||
| 100% attributable to Exxaro2 | Resources inside LoMP | ||||||||||||||||
| Matla mine7 |  |
Measured | 713 | 20.2 | 30.6 | 4.5 | 1.0 | 641 | 20.1 | 30.9 | 4.5 | 1.0 | 11 | ||||
| (UG) | Indicated | 97 | 20.8 | 28.1 | 4.4 | 0.9 | 204 | 20.0 | 30.3 | 4.5 | 0.9 | (52) | |||||
| (captive market) | Inferred | 240 | 19.6 | 30.9 | 4.5 | 0.9 | 251 | 19.9 | 29.6 | 4.6 | 0.9 | (4) | |||||
| Mpumalanga | Total | 1 050 | 20.1 | 30.4 | 4.5 | 1.0 | 1 096 | 20.0 | 30.5 | 4.5 | 1.0 | (4) | |||||
| 100% attributable to Exxaro2 | Resources inside LoMP | 327 | 21.1 | 27.7 | 4.7 | 1.0 | 354 | 21.1 | 27.8 | 4.6 | 1.0 | (8) | |||||
| Leeuwpan mine8 |  |
Measured | 101.1 | 20.1 | 31.3 | 3.2 | 18.7 | 1.1 | 115.6 | 20.5 | 31.2 | 3.2 | 1.1 | (13) | |||
| (OC) | Indicated | 2.6 | 20.7 | 29.1 | 2.8 | 21.1 | 1.2 | ||||||||||
| (commercial market) | Inferred | 3.6 | 21.0 | 32.3 | 2.3 | 14.0 | 1.1 | 3.7 | 21.1 | 32.1 | 2.3 | 1.2 | (2) | ||||
| Mpumalanga | Total | 107.3 | 20.1 | 31.3 | 3.2 | 18.6 | 1.1 | 119.3 | 20.5 | 31.3 | 3.2 | 1.1 | (10) | ||||
| 100% attributable to Exxaro2 | Resources inside LoMP | 71.7 | 20.0 | 31.1 | 3.1 | 19.6 | 1.2 | 94.7 | 20.4 | 31.5 | 3.1 | 1.2 | (24) | ||||
| Mafube mine9 |  |
Measured | 124.5 | 21.5 | 26.9 | 3.8 | 1.0 | 129.3 | 21.6 | 26.8 | 3.8 | 1.0 | (4) | ||||
| (OC) | Indicated | 10.1 | 22.0 | 25.7 | 3.9 | 0.9 | 10.1 | 22.0 | 25.7 | 3.9 | 0.9 | 0 | |||||
| (commercial market) | Inferred | ||||||||||||||||
| Mpumalanga | Total | 134.7 | 21.6 | 26.8 | 3.8 | 1.0 | 139.4 | 21.6 | 26.7 | 3.8 | 1.0 | (3) | |||||
| 50% attributable to Exxaro2 | Resources inside LoMP | 61.7 | 21.9 | 25.6 | 3.7 | 1.0 | 64.6 | 22.0 | 25.6 | 3.7 | 1.0 | (4) | |||||
| NBC mine10 |  |
Measured | Disinvested | 15.0 | 21.1 | 27.3 | 3.9 | 0.9 | |||||||||
| (OC) | Indicated | ||||||||||||||||
| (commercial market) | Inferred | ||||||||||||||||
| Mpumalanga | Total | 15.0 | 21.1 | 27.3 | 3.9 | 0.9 | |||||||||||
| 100% attributable to Exxaro2 | Resources inside LoMP | 4.1 | 20.5 | 29.4 | 3.8 | 0.7 | |||||||||||
| Glisa South project11 |  |
Measured | Disinvested | 62.1 | 19.0 | 31.6 | 3.4 | 0.9 | |||||||||
| (prospecting) | Indicated | 16.2 | 20.7 | 28.6 | 3.5 | 1.0 | |||||||||||
| Mpumalanga | Inferred | 13.2 | 20.3 | 29.4 | 3.4 | 1.2 | |||||||||||
| 100% attributable to Exxaro2 | Total | 91.5 | 19.5 | 30.8 | 3.4 | 1.0 | |||||||||||
| Belfast project12 |  |
Measured | 81.1 | 24.8 | 18.7 | 3.6 | 1.1 | 81.1 | 24.8 | 18.7 | 3.6 | 1.1 | 0 | ||||
| (OC) | Indicated | 22.4 | 21.6 | 26.9 | 3.7 | 1.1 | 22.4 | 21.6 | 26.9 | 3.7 | 1.1 | 0 | |||||
| (mining right) | Inferred | 34.4 | 20.0 | 31.2 | 3.4 | 1.0 | 34.4 | 20.0 | 31.2 | 3.4 | 1.0 | 0 | |||||
| Mpumalanga | Total | 137.8 | 23.1 | 23.2 | 3.6 | 1.1 | 137.8 | 23.1 | 23.2 | 3.6 | 1.1 | 0 | |||||
| 100% attributable to Exxaro2 | Resources inside LoMP | 47.1 | 25.2 | 17.6 | 3.6 | 1.2 | 47.1 | 25.2 | 17.6 | 3.6 | 1.2 | 0 | |||||
| Dorstfontein complex13 |  |
Measured | 156.4 | 19.9 | 33.3 | 2.9 | 1.1 | 158.1 | 19.9 | 33.4 | 2.9 | 1.1 | (1) | ||||
| (OC/UG) | Indicated | 137.5 | 19.3 | 34.2 | 3.2 | 1.2 | 142.4 | 19.2 | 34.6 | 3.1 | 1.2 | (3) | |||||
| (commercial market) | Inferred | 52.8 | 19.3 | 34.6 | 2.9 | 1.1 | 47.4 | 19.4 | 34.4 | 2.9 | 1.1 | 11 | |||||
| Mpumalanga | Total | 346.7 | 19.6 | 33.9 | 3.0 | 1.1 | 347.9 | 19.5 | 34.1 | 2.9 | 1.1 | (0) | |||||
| 74% attributable to Exxaro2 | Resources inside LoMP | 228.8 | 19.9 | 32.7 | 3.0 | 1.1 | 62.3 | 21.3 | 29.1 | 3.1 | 1.0 | 267 | |||||
| Rietkuil Vhakoni |  |
Measured | 81.9 | 19.1 | 36.0 | 2.5 | 1.1 | 82.3 | 19.0 | 36.2 | 2.6 | 1.0 | 0 | ||||
| (prospecting right) | Indicated | 11.6 | 18.6 | 37.4 | 2.8 | 1.2 | 11.6 | 18.6 | 37.4 | 2.8 | 1.2 | 0 | |||||
| Mpumalanga | Inferred | 8.3 | 18.5 | 37.7 | 2.8 | 1.0 | 8.6 | 18.5 | 37.2 | 2.6 | 1.0 | (3) | |||||
| 74% attributable to Exxaro2 | Total | 101.8 | 19.0 | 36.3 | 2.6 | 1.1 | 102.5 | 18.7 | 37.0 | 2.6 | 1.0 | (1) | |||||
| Forzando mine |  |
Measured | 81.5 | 21.6 | 29.1 | 2.8 | 1.1 | 83.1 | 21.6 | 29.1 | 2.8 | 1.1 | (2) | ||||
| (OC/UG) | Indicated | 35.9 | 22.3 | 27.5 | 2.8 | 1.2 | 35.2 | 22.2 | 27.6 | 2.8 | 1.2 | 2 | |||||
| (commercial market) | Inferred | 25.8 | 21.3 | 30.1 | 2.9 | 1.2 | 26.1 | 21.2 | 30.2 | 2.9 | 1.2 | (1) | |||||
| Mpumalanga | Total | 143.2 | 21.8 | 28.9 | 2.8 | 1.2 | 144.4 | 21.7 | 28.8 | 2.8 | 1.2 | (1) | |||||
| 87% attributable to Exxaro2 | Resources inside LoMP | 70.3 | 21.2 | 30.0 | 2.8 | 1.1 | 74.1 | 21.4 | 29.6 | 2.8 | 1.1 | (5) | |||||
| Forzando projects |  |
Measured | 0.9 | 21.8 | 28.8 | 3.3 | 1.3 | 0.2 | 21.4 | 30.6 | 2.5 | 0.5 | 291 | ||||
| (prospecting right) | Indicated | 16.5 | 20.4 | 21.3 | 3.1 | 1.5 | 16.5 | 20.4 | 21.3 | 3.1 | 1.5 | 0 | |||||
| Mpumalanga | Inferred | 4.3 | 20.9 | 32.9 | 2.5 | 1.4 | 4.3 | 20.9 | 32.9 | 2.5 | 1.4 | (1) | |||||
| 86.75% attributable to Exxaro2 | Total | 21.7 | 20.6 | 23.9 | 3.0 | 1.5 | 21.0 | 20.6 | 24.9 | 2.9 | 1.5 | 3 | |||||
| Schurvekop 1063 PR14 |  |
Measured | 35.0 | 20.2 | 31.7 | 3.3 | 1.2 | 35.0 | 20.2 | 31.7 | 3.3 | 1.2 | 0 | ||||
| (prospecting right) | Indicated | 5.6 | 20.1 | 31.7 | 3.4 | 1.1 | 5.6 | 20.0 | 31.8 | 3.3 | 1.1 | 0 | |||||
| Mpumalanga | Inferred | 0.2 | 19.7 | 32.3 | 3.8 | 0.8 | 0.2 | 19.7 | 32.3 | 3.8 | 0.8 | (1) | |||||
| 86.75% attributable to Exxaro2 | Total | 40.8 | 20.1 | 31.7 | 3.3 | 1.2 | 40.8 | 20.2 | 31.7 | 3.3 | 1.2 | 0 | |||||
| Tumelo mine |  |
Measured | 8.7 | 21.7 | 29.7 | 2.5 | 1.5 | 8.7 | 21.7 | 29.7 | 2.5 | 1.5 | 0 | ||||
| (UG) | Indicated | 0.2 | 20.6 | 32.8 | 2.5 | 1.6 | 0.2 | 20.6 | 32.8 | 2.5 | 1.6 | 0 | |||||
| Mpumalanga | Inferred | 1.8 | 21.4 | 31.0 | 2.4 | 1.8 | 1.8 | 21.4 | 31.0 | 2.4 | 1.8 | 0 | |||||
| 49% attributable to Exxaro2 | Total | 10.7 | 21.6 | 29.9 | 2.5 | 1.6 | 10.7 | 21.6 | 29.9 | 2.5 | 1.6 | 0 | |||||
| Grootegeluk mine |  |
Measured | 2 844 | 16.7 | 47.8 | 1.7 | 1.5 | 2 902 | 16.7 | 47.8 | 1.7 | 1.5 | (2) | ||||
| (OC) | Indicated | 1 017 | 16.5 | 48.4 | 1.6 | 1.4 | 1 017 | 16.5 | 48.4 | 1.6 | 1.4 | 0 | |||||
| (commercial market) | Inferred | 653 | 16.5 | 48.0 | 1.8 | 1.5 | 653 | 16.5 | 48.0 | 1.8 | 1.5 | 0 | |||||
| Limpopo | Total | 4 514 | 18.2 | 48.0 | 1.7 | 1.5 | 4 572 | 16.6 | 48.0 | 1.7 | 1.5 | (1) | |||||
| 100% attributable to Exxaro2 | Resources inside GG open-cast LoMP | 3 780 | 16.3 | 48.8 | 1.7 | 1.5 | 3 837 | 16.3 | 48.8 | 1.7 | 1.5 | (1) | |||||
| Thabametsi project15 |  |
Measured | 270 | 13.0 | 52.3 | 1.9 | 1.2 | 270 | 13.0 | 52.3 | 1.9 | 1.2 | 0 | ||||
| (OC/UG) | Indicated | 749 | 12.6 | 53.1 | 1.8 | 1.1 | 749 | 12.6 | 53.1 | 1.8 | 1.1 | 0 | |||||
| (mining right) | Inferred | 2 916 | 12.7 | 52.7 | 1.9 | 1.3 | 2 916 | 12.7 | 52.7 | 1.9 | 1.3 | 0 | |||||
| Limpopo | Total | 3 935 | 12.7 | 52.7 | 1.9 | 1.3 | 3 935 | 12.7 | 52.7 | 1.9 | 1.3 | 0 | |||||
| 100% attributable to Exxaro2 | Resources inside IPP LoMP | 133 | 12.0 | 54.7 | 1.9 | 1.0 | 133 | 12.0 | 54.7 | 1.9 | 1.0 | 0 | |||||
| Waterberg North project16 | |
Measured | |||||||||||||||
| (prospecting) | Indicated | ||||||||||||||||
| Limpopo | Inferred | 2 147 | 13.3 | 49.7 | 2.5 | 1.2 | 2 147 | 13.3 | 49.7 | 2.5 | 1.2 | 0 | |||||
| 100% attributable to Exxaro2 | Total | 2 147 | 13.3 | 49.7 | 2.5 | 1.2 | 2 147 | 13.3 | 49.7 | 2.5 | 1.2 | 0 | |||||
| Waterberg South project17 |  |
Measured | |||||||||||||||
| (prospecting) | Indicated | ||||||||||||||||
| Limpopo | Inferred | 869 | 15.9 | 39.6 | 2.9 | 1.7 | 869 | 15.9 | 39.6 | 2.9 | 1.7 | 0 | |||||
| 100% attributable to Exxaro2 | Total | 869 | 15.9 | 39.6 | 2.9 | 1.7 | 869 | 15.9 | 39.6 | 2.9 | 1.7 | 0 | |||||
| Moranbah South project18 |  |
Measured | 482 | 26.7 | 23.7 | 2.6 | 0.6 | 482 | 26.7 | 23.7 | 2.6 | 0.6 | 0 | ||||
| (UG) (prospecting) | Indicated | 222 | 27.3 | 21.7 | 2.6 | 0.6 | 222 | 27.3 | 21.7 | 2.6 | 0.6 | 0 | |||||
| Australia | Inferred | 28 | 28.5 | 18.9 | 2.7 | 0.5 | 28 | 28.5 | 18.9 | 2.7 | 0.5 | 0 | |||||
| 50% attributable to Exxaro2 | Total | 732 | 27.0 | 22.9 | 2.6 | 0.6 | 732 | 27.0 | 22.9 | 2.6 | 0.6 | 0 | |||||
•Rounding figures may cause computational discrepancies
•All changes more than 10% are explained
•Tonnages are quoted in metric tonnes and million tonnes is abbreviated as Mt
•Coal Resources and qualities (raw coal) are quoted on a mineable tonnage in-situ (MTIS) and air-dried basis
• Coal Resources are quoted inclusive of coal resources that have been modifi ed to Coal Reserves unless otherwise stated
•Resources inside life-of-mine plan (LoMP) refer to total mineable tonnes in-situ (MTIS) resources in LoMP layout
1 Operation refers to operating mine or signifi cant project. Mining method: OC — opencut, UG — underground
2 Figures are reported at 100% irrespective of percentage attributable to Exxaro and refer to 2018 only
3 Locality maps are for illustrative purposes only. Detailed maps are provided in the ancillary section
4 Raw coal qualities (air-dried basis). CV: calorifi c value (gross), IM: inherent moisture, S: total sulphur, VM: volatile matter
5 The percentage difference between 2018 reported MTIS and 2017 reported MTIS. Brackets signify a negative
6 Mine is in closure. The remaining Coal Resources have reasonable prospects for eventual economic extraction
7 Movements within resource categories are the result of updated geological model and revised resource classification
8 Decrease is primarily the result of mining depletion (6.9Mt) and disposals due to environmental and infrastructure considerations (7.9Mt)
9 Estimates are received from Anglo American Coal Proprietary Limited and not audited by Exxaro
10 Exxaro divested from the operation
11 The project forms part of the North Block Complex (NBC). Exxaro divested from NBC
12 Mine is currently under construction
13 The complex comprises the East (opencast) and West (underground) operations
14 Estimates are received from Mmakau Mining, the majority (51%) owner of the project
15 Project is adjacent to the operating Grootegeluk mine
16 Reasonable prospects for eventual economic extraction are guided by potential economic value as indicated by a concept mining exploitation strategy
17 Reasonable prospects for eventual economic extraction are guided by potential economic value as indicated by a concept mining exploitation strategy
18 Estimates are received from Anglo American Metallurgical Coal Proprietary Limited and not audited by Exxaro
The table below details the total Coal Reserves estimated as at 31 December 2018.
Table 5: Coal Reserves reported for 2018
| 2018 - ROM and saleable tonnes5 | 2017 — ROM and saleable tonnes5 | |||||||||||||||
| Operation1 | Location3 | Life of mine (years)4 |
Category | ROM (Mt) |
ROM moisture % |
Export (Mt) |
Thermal (Mt) |
Metal- lurgical (Mt) |
ROM (Mt) |
Export (Mt) |
Thermal (Mt) |
Metal- lurgical (Mt) |
% change in ROM6 |
|||
| Matla mine7 |
 |
6+ | Proved | 171.6 | 7.8 | 171.6 | 194.9 | 194.9 | (12) | |||||||
|---|---|---|---|---|---|---|---|---|---|---|---|---|---|---|---|---|
| (UG) | Probable | 16.3 | 6.3 | 16.3 | 36.8 | 36.1 | (56) | |||||||||
| (captive market) | Total | 187.9 | 7.6 | 187.9 | 231.7 | 231.0 | (19) | |||||||||
| 100% attributable to Exxaro2 | Inferred resources inside life-of-mine plan (LoMP) | 25.6 | 9.3 | 176 | ||||||||||||
| Leeuwpan |  |
12 | Proved | 53.7 | 3.2 | 38.8 | 61.9 | 43.2 | 1.0 | (13) | ||||||
| (OC) | Probable | 6.2 | 2.7 | 2.3 | 0.4 | 3.3 | 2.0 | 90 | ||||||||
| (commercial market) | Total | 59.8 | 3.1 | 41.0 | 0.4 | 65.1 | 45.2 | 1.0 | (8) | |||||||
| 100% attributable to Exxaro2 | Inferred resources inside LoMP | |||||||||||||||
| Mafube8 |  |
12 | Proved | 0.8 | 0.5 | 0.2 | (100) | |||||||||
| Probable | 62.0 | 8.3 | 26.5 | 13.9 | 64.0 | 27.4 | 14.3 | (3) | ||||||||
| (commercial market) | Total | 62.0 | 8.3 | 26.5 | 13.9 | 64.8 | 27.9 | 14.5 | (4) | |||||||
| 50% attributable to Exxaro2 | Inferred resources inside LoMP | |||||||||||||||
| NBC mine9 |  |
- | Proved | Disinvest | 1.5 | 1.1 | ||||||||||
| (OC) | Probable | 1.4 | 1.3 | |||||||||||||
| (commercial market) | Total | 2.9 | 2.4 | |||||||||||||
| 100% attributable to Exxaro2 | Inferred resources inside LoMP | |||||||||||||||
| Belfast project |  |
17 | Proved | 45.7 | 3.6 | 35.3 | 8.1 | 45.7 | 35.3 | 8.1 | 0 | |||||
| (OC) | Probable | |||||||||||||||
| (commercial market) | Total | 45.7 | 3.6 | 35.3 | 8.1 | 45.7 | 35.3 | 8.1 | 0 | |||||||
| 100% attributable to Exxaro2 | Inferred resources inside LoMP | 0.5 | 0.5 | 0 | ||||||||||||
| Dorstfontein complex10 |  |
23 | Proved | 54.3 | 2.7 | 29.4 | 36.5 | 20.4 | 49 | |||||||
| (OC/UG) | Probable | 40.5 | 3.1 | 24.6 | 7.7 | 4.6 | 426 | |||||||||
| (commercial market) | Total | 94.8 | 2.9 | 54.0 | 44.2 | 25.0 | 114 | |||||||||
| 74% attributable to Exxaro2 | Inferred resources inside LoMP | 5.7 | 2.8 | 2.8 | 2.3 | 148 | ||||||||||
| Forzando mine |  |
10+ | Proved | 38.6 | 2.2 | 19.9 | 37.8 | 20.8 | 2 | |||||||
| (UG) | Probable | 15.9 | 2.8 | 9.3 | 16.3 | 9.4 | (2) | |||||||||
| (commercial market) | Total | 54.5 | 2.4 | 29.2 | 54.1 | 30.1 | 1 | |||||||||
| 74% attributable to Exxaro2 | Inferred resources inside LoMP | 7.5 | 2.5 | 4.0 | 7.1 | 6 | ||||||||||
| 2018 - ROM and saleable tonnes5 | 2017 — ROM and saleable tonnes5 | |||||||||||||||
| Operation1 | Location3 | Life of mine (years)4 |
Category | ROM (Mt) |
ROM moisture % |
Export (Mt) |
Thermal (Mt) |
Metal- lurgical (Mt) |
ROM (Mt) |
Export (Mt) |
Thermal (Mt) |
Metal- lurgical (Mt) |
% change in ROM6 |
|||
| Waterberg Complex | ||||||||||||||||
| Grootegeluk mine |  |
22+ | Proved | 2 576 | 3.0 | 149 | 1 039 | 72 | 2 633 | 151 | 1 065 | 73 | (2) | |||
|---|---|---|---|---|---|---|---|---|---|---|---|---|---|---|---|---|
| (OC) | Probable | 645 | 3.0 | 60 | 398 | 26 | 645 | 60 | 398 | 26 | 0 | |||||
| (commercial market) | Total | 3 221 | 3.0 | 209 | 1 437 | 98 | 3 278 | 211 | 1 463 | 99 | (2) | |||||
| 100% attributable to Exxaro2 | Inferred resources inside LoMP | 510 | 510 | 0 | ||||||||||||
| Thabametsi project |  |
27+ | Proved | 109.0 | 3.0 | 107.0 | 109.0 | 107.0 | 0 | |||||||
| (OC) | Probable | 21.0 | 3.0 | 20.0 | 21.0 | 20.0 | 0 | |||||||||
| (IPP market) | Total | 130.0 | 3.0 | 127.0 | 130.0 | 127.0 | 0 | |||||||||
| 100% attributable to Exxaro2 | Inferred resources inside LoMP | |||||||||||||||
1 Operation refers to operating mine or significant project. Mining method: OC - opencut, UG - underground
2 Figures are reported at 100% irrespective of percentage attributable to Exxaro and refer to 2018 only
3 Locality maps are for illustrative purposes only. Detailed maps are provided in the ancillary section
4The + symbol is used in instances where the scheduled LoMP extends beyond the expiry of the mining right. In each instance, Exxaro has a reasonable expectation that the mining right will be renewed
5Export refers to export thermal coal except at Grootegeluk mine where it refers to semi-soft coking coal, suitable for both the export and inland market
6The percentage difference between 2018 reported ROM and 2017 reported ROM and the percentage difference between 2018 reported total saleable tonnes and 2017 reported total saleable tonnes. Brackets signify a negative
7LoMP exceeds the mining right, expiring in 2025. The total decrease and movement within categories are the result of a change in the resource base (~6%) and reduction in pillar extraction recovery after reviewing the extraction process to enhance safety and ventilation and considering actual extraction figures in the reporting period
8Estimates are received from Anglo American Coal Proprietary Limited and not audited by Exxaro
9Exxaro divested from the operation
10The increase reflects incorporation of the 2017 geological model in the updated LoM and coal reserve classification for both Dorstfontein West and Dorstfontein East operations. This resulted in including a material amount of seams 2 and 4 lower in the underground reserve at the Dorstfontein operation
Table 6: Coal Reserve qualities 2018
| Thermal saleable (proved + probable) | Metallurgical saleable (proved + probable) | Coking saleable (proved + probable) | |||||||||||||||||
| Operation1 | Seam/layer | Tonnes (Mt)1 |
CV MJ/ kg |
% VM |
% Ash |
% S |
Yield % |
Tonnes (Mt)1 |
CV MJ/ kg |
% VM |
% Ash |
% S |
Yield % |
Tonnes (Mt)1 |
CV MJ/ kg |
% VM |
% Ash |
% S |
Yield % |
| Matla mine | Seam 2 | 61.0 | 22.4 | 23.7 | 21.7 | 0.8 | 100 | ||||||||||||
| Seam 4 | 126.9 | 19.3 | 21.4 | 26.7 | 1.0 | 100 | |||||||||||||
| Leeuwpan mine | TC2 | 16.0 | 22.9 | 19.4 | 25.3 | 0.9 | 57 | ||||||||||||
| BC2 | 25.0 | 23.7 | 22.7 | 22.6 | 1.0 | 80 | 0.4 | 28.0 | 8.2 | 15.0 | 0.9 | 58 | |||||||
| Mafube Mine | Middlings | 13.9 | 22.0 | 21.7 | 25.0 | 0.6 | 22 | ||||||||||||
| Export | 26.5 | 26.5 | 26.3 | 13.6 | 0.4 | 43 | |||||||||||||
| NBC | All seams | Disinvested | |||||||||||||||||
| Belfast project | Thermal | 8.1 | 21.9 | 22.4 | 26.6 | 1.8 | 53 | ||||||||||||
| Export | 35.3 | 26.9 | 24.1 | 13.7 | 0.5 | 76 | |||||||||||||
| Dorstfontein complex | All seams | 54.0 | 24.6 | 21.9 | 19.1 | 0.6 | 57 | ||||||||||||
| Forzando mines | All seams | 29.2 | 24.4 | 23.7 | 17.6 | 0.9 | 54 | ||||||||||||
| Grootegeluk mine | All seams | 1 437 | 21.0 | 23.8 | 33.1 | 1.5 | 42 | 98 | 29.0 | 23.9 | 13.7 | 0.6 | 60 | 209 | 29.1 | 35.1 | 11.7 | 1.2 | 13 |
| Thabametsi project3 | T1 | 64.0 | 12.7 | 20.0 | 53.9 | 1.1 | 98 | ||||||||||||
| T2 | 63.0 | 11.3 | 19.0 | 55.7 | 1.0 | 98 | |||||||||||||
1 Saleable product tonnages are quoted in metric tonnes and million tonnes is abbreviated as Mt
2 TC: Top coal BC: bottom coal
3 Based on Thabametsi bench configuration as defined in phase 1 feasibility study
Mineral Sands Resources as on 31 December 2018
Table 7: Mineral Sands Resources reported for 2018
| 2018 - tonnes and grade | 2017 - tonnes and grade | ||||||||||
| Operation1 | Category | Tonnes (Mt) |
% Ilmenite |
% Zircon |
Tonnes (Mt) |
% Ilmenite |
% Zircon |
Change in tonnes % |
|||
| Hillendale mine | Measured | 12.2 | 2.9 | 12.2 | 2.9 | 0 | |||||
|---|---|---|---|---|---|---|---|---|---|---|---|
| KwaZulu-Natal | Indicated | ||||||||||
| (OC) (in closure) | Inferred | ||||||||||
| 43.3% attributable to Exxaro2 | Total | 12.2 | 12.2 | 2.9 | 0 | ||||||
| Fairbreeze mine3 | Measured | 287.5 | 3.5 | 149.7 | 4.1 | 92 | |||||
| KwaZulu-Natal | Indicated | 9.1 | 2.1 | 55.7 | 2.6 | (84) | |||||
| (OC) (mining right) | Inferred | 53.7 | 1.8 | 9.0 | 1.9 | 497 | |||||
| 43.3% attributable to Exxaro2 | Total | 350.3 | 3.2 | 214.4 | 3.6 | 63 | |||||
| Block P | Measured | ||||||||||
| KwaZulu-Natal | Indicated | 40.6 | 3.1 | 40.6 | 3.1 | 0 | |||||
| (OC) (mining right) | Inferred | ||||||||||
| 43.3% attributable to Exxaro2 | Total | 40.6 | 3.1 | 40.6 | 3.1 | 0 | |||||
| Port Durnford project | Measured | 143 | 3.0 | 143 | 3.0 | 0 | |||||
| KwaZulu-Natal | Indicated | 340 | 2.8 | 340 | 2.8 | 0 | |||||
| (OC) (prospecting) | Inferred | 466 | 2.5 | 466 | 2.5 | 0 | |||||
| 43.3% attributable to Exxaro2 | Total | 949 | 2.7 | 949 | 2.7 | 0 | |||||
| Namakwa sands mine | Measured | 630 | 2.7 | 0.6 | 648 | 2.7 | 0.6 | (3) | |||
| Western Cape | Indicated | 365 | 2.3 | 0.5 | 369 | 2.3 | 0.5 | (1) | |||
| (OC) (mining right) | Inferred | 580 | 1.5 | 0.3 | 581 | 1.5 | 0.3 | 0 | |||
| 43.3% attributable to Exxaro2 | Total | 1 575 | 2.2 | 0.5 | 1 598 | 2.2 | 0.5 | (1) | |||
| 2018 - tonnes and grade | 2017 - tonnes and grade | |||||||||
| Operation1 | Category | Tonnes (Mt) |
% total heavy minerals (THM) |
Tonnes (Mt) |
% total heavy minerals (THM) |
Change in tonnes % |
||||
| Cooljarloo mine | Measured | 272 | 1.8 | 296 | 1.8 | (8) | ||||
|---|---|---|---|---|---|---|---|---|---|---|
| Western Australia | Indicated | 204 | 1.7 | 204 | 1.7 | 0 | ||||
| (OC) | Inferred | |||||||||
| 23.35% attributable to Exxaro2 | Total | 477 | 1.8 | 501 | 1.8 | (5) | ||||
| Cooljarloo West project4 | Measured | |||||||||
| Western Australia | Indicated | 211 | 1.7 | 177 | 1.8 | 19 | ||||
| (OC) (mining right) | Inferred | |||||||||
| 23.35% attributable to Exxaro2 | Total | 211 | 1.7 | 177 | 1.8 | 19 | ||||
| Cooljarloo North West project | Measured | |||||||||
| Western Australia | Indicated | |||||||||
| (OC) (prospecting) | Inferred | 142 | 2.1 | 142 | 2.1 | 0 | ||||
| 23.35% attributable to Exxaro2 | Total | 142 | 2.1 | 142 | 2.1 | 0 | ||||
| Jurien project | Measured | 36 | 5.8 | 36 | 5.8 | 0 | ||||
| Western Australia | Indicated | 6 | 3.3 | 6 | 3.3 | 0 | ||||
| (OC) (mining right) | Inferred | 1 | 1 | 0 | ||||||
| 23.35% attributable to Exxaro2 | Total | 43 | 5.4 | 43 | 5.4 | 0 | ||||
| Dongara project | Measured | 107 | 3.9 | 107 | 3.9 | 0 | ||||
| Western Australia | Indicated | 31 | 3.5 | 18 | 4.5 | 73 | ||||
| (OC) (mining right) | Inferred | 38 | 2.7 | 39 | 2.7 | (4) | ||||
| 23.35% attributable to Exxaro2 | Total | 175 | 3.6 | 164 | 3.7 | 7 | ||||
1 Operation refers to operating mine or significant project. Mining method: OC - opencut, UG - underground
2 Figures are reported at 100% irrespective of percentage attributable to Exxaro and refer to 2018 only
3 The increase (~136Mt) is the result of new drilling information
4 The increase is primarily the result of a change in the resource base
Mineral Sands Mineral Reserves as on 31 December 2018
Table 8: Mineral Sands Reserves reported for 2018
| 2018 - ROM and grade | 2017 — ROM and grade | |||||||||||||
| Total heavy mineral (THM) composition | ||||||||||||||
| Operation1 | Life of mine (years)3 | Category | ROM (Mt) |
% THM |
% Ilmenite |
% Rutile |
% Zircon |
% Leucoxene |
ROM (Mt) |
% THM |
Change in ROM % |
|||
| Fairbreeze mine4 | 17+ | Proved | 231 | 5.9 | 3.7 | 0.3 | 0.5 | 0.1 | 131 | 6.7 | 76 |
|||
|---|---|---|---|---|---|---|---|---|---|---|---|---|---|---|
| KwaZulu-Natal | Probable | 11 | 3.7 | 1.9 | 0.1 | 0.3 | 0.1 | 45 | 4.6 | (76) | ||||
| (OC) (mining right) | Total | 242 | 5.8 | 3.6 | 0.3 | 0.5 | 0.1 | 177 | 6.2 | 37 | ||||
| 43.3% attributable to Exxaro2 | Inferred resources inside LoMP | |||||||||||||
| Namakwa sands mine | 26+ | Proved | 172 | 8.3 | 3.0 | 0.2 | 0.8 | 0.5 | 195 | 8.6 | (12) |
|||
| Western Cape | Probable | 485 | 5.5 | 2.8 | 0.2 | 0.6 | 0.4 | 492 | 5.5 | (1) | ||||
| (OC) (mining right) | Total | 657 | 6.2 | 2.8 | 0.2 | 0.7 | 0.4 | 687 | 6.4 | (4) | ||||
| 43.3% attributable to Exxaro2 | Inferred resources inside LoMP | |||||||||||||
| Cooljarloo mine | 13+ | Proved | 270 | 1.8 | 61.0 | 5.4 | 10.2 | 2.3 | 294 | 1.8 | (8) | |||
| Western Australia | Probable | 20 | 2.1 | 61.8 | 5.2 | 9.4 | 2.6 | 20 | 2.1 | 0 | ||||
| (OC) | Total | 289 | 1.9 | 61.1 | 5.4 | 10.2 | 2.3 | 314 | 1.9 | (8) | ||||
| 23.35% attributable to Exxaro2 | Inferred resources inside LoMP | |||||||||||||
| Cooljarloo West project5 | 9 | Proved | ||||||||||||
| Western Australia | Probable | 130 | 2.0 | 60.5 | 5.4 | 12.2 | 2.9 | 105 | 2.0 | 24 | ||||
| (OC) (mining right) | Total | 130 | 2.0 | 60.5 | 5.4 | 12.2 | 2.9 | 105 | 2.0 | 24 | ||||
| 23.35% attributable to Exxaro2 | Inferred resources inside LoMP | |||||||||||||
| Dongara project | 12+ | Proved | 62 | 5.2 | 48.7 | 6.1 | 10.9 | 2.8 | 62 | 5.2 | 0 | |||
| Western Australia | Probable | |||||||||||||
| (OC) (mining right) | Total | 62 | 5.2 | 48.7 | 6.1 | 10.9 | 2.8 | 62 | 5.2 | 0 | ||||
| 23.35% attributable to Exxaro2 | Inferred resources inside LoMP | |||||||||||||
1 Operation refers to operating mine or significant project. Mining method: OC — opencut, UG — underground
2 Figures are reported at 100% irrespective of percentage attributable to Exxaro and refer to 2018 only
3 The + symbol is used where the scheduled LoMP extends beyond the expiry of the mining right
4 The increase is primarily the result of a change in the resource base
5 The increase is primarily the result of a change in the resource base as well as remodelling and optimisation of the Woolka Road, Harrier and Kestrel reserve areas
Base Metal Resources - exclusive - as at 31 March 2018
Table 9: Base Metal Resources (exclusive) reported for 2018
| 2018 - tonnes and grade | 2017 - tonnes and grade | |||||||||||||||
| Operation1 | Category | Tonnes (Mt) |
%Zn | % Pb |
% Cu |
Ag g/t |
Tonnes (Mt) |
% Zn |
% Pb |
% Cu |
Ag g/t |
% change in tonnes |
||||
| Deeps mine3 | Measured | 4.0 | 3.1 | 3.4 | 0.3 | 38.1 | 2.9 | 3.6 | 3.9 | 0.4 | 41.5 | 37 | ||||
|---|---|---|---|---|---|---|---|---|---|---|---|---|---|---|---|---|
| Northern Cape | Indicated | 6.6 | 2.8 | 2.7 | 0.5 | 32.7 | 4.1 | 3.0 | 3.0 | 0.5 | 33.9 | 62 | ||||
| (UG) (zinc, lead, copper and silver) | Inferred | |||||||||||||||
| 26% attributable to Exxaro2 | Total | 10.6 | 2.9 | 3.0 | 0.4. | 34.7 | 7.0 | 3.3 | 3.4 | 0.5 | 37.0 | 52 | ||||
| Swartberg mine4 | Measured | |||||||||||||||
| Northern Cape | Indicated | 35.7 | 0.8 | 3.7 | 0.3 | 57.0 | 45.4 | 0.5 | 3.2 | 0.5 | 30.7 | (21) | ||||
| (UG) (zinc, lead, copper and silver) | Inferred | 26.5 | 2.2 | 3.0 | 0.2 | 50.2 | 4.7 | 0.8 | 2.8 | 0.2 | 52.2 | 459 | ||||
| 26% attributable to Exxaro2 | Total | 62.2 | 1.4 | 3.4 | 0.3 | 54.1 | 50.1 | 0.6 | 3.2 | 0.5 | 32.8 | 24 | ||||
| Gamsberg North mine | Measured | 43.3 | 6.6 | 0.6 | 43.3 | 6.6 | 0.6 | 0 | ||||||||
| Northern Cape | Indicated | 54.6 | 5.9 | 0.5 | 54.6 | 5.9 | 0.5 | 0 | ||||||||
| (OC) (zinc) | Inferred | 32.1 | 5.8 | 0.5 | 32.1 | 5.8 | 0.5 | 0 | ||||||||
| 26% attributable to Exxaro2 | Total | 130.0 | 6.1 | 0.5 | 130.0 | 5.8 | 0.5 | 0 | ||||||||
| Gamsberg East | Measured | |||||||||||||||
| Northern Cape | Indicated | |||||||||||||||
| (project) (zinc) | Inferred | 32.3 | 9.8 | 0.6 | 32.3 | 9.8 | 0.6 | 0 | ||||||||
| 26% attributable to Exxaro2 | Total | 32.3 | 9.8 | 0.6 | 32.3 | 9.8 | 0.6 | 0 | ||||||||
1 Operation refers to Black Mountain Mining operating mine or significant project. Mining method: OC - opencut, UG - underground
2 Figures are reported at 100% irrespective of percentage attributable to Exxaro
3 The increase is mainly the result of updating the geological model with new mapping and drilling information as well as the use of higher input metal prices which allowed for a greater increase in economical tonnes
4 The increase is mainly the result of updating the geological model with new drillhole information and model refinement
Base Metal Reserves - exclusive - as at 31 March 2018
Table 10: Base Metal Reserves (exclusive) reported for 2018
| 2018 - ROM, grade and contained metals | 2017 - ROM, grade and contained metals | ||||||||||||||||
| Operation1 | Life of mine (years) |
Category | ROM (Mt)3 |
% Zn |
% Pb |
% Cu |
Ag g/t |
ROM (Mt)3 |
% Zn |
% Pb |
% Cu |
Ag g/t |
% change in ROM |
||||
| BMM Deeps mine | 6 | Proved | 1.3 | 3.0 | 4.0 | 0.3 | 43.3 | 1.7 | 2.9 | 3.5 | 0.4 | 42.8 | (27) |
||||
|---|---|---|---|---|---|---|---|---|---|---|---|---|---|---|---|---|---|
| Northern Cape | Probable | 4.3 | 3.0 | 1.7 | 0.7 | 23.8 | 4.3 | 2.8 | 2.1 | 0.7 | 25.9 | 0 | |||||
| (UG) (zinc, lead, copper and silver) | Total | 5.6 | 3.0 | 2.2 | 0.6 | 28.2 | 6.1 | 2.9 | 2.5 | 0.6 | 30.8 | (8) | |||||
| 26% attributable to Exxaro2 | Inferred resources inside life-of-mine plan (LoMP) | ||||||||||||||||
| BMM Swartberg mine3 | 6 | Proved | |||||||||||||||
| Northern Cape | Probable | 2.3 | 0.6 | 3.3 | 0.5 | 30.8 | 2.1 | 0.6 | 3.7 | 0.5 | 31.6 | 13 | |||||
| (UG) (zinc, lead, copper and silver) | Total | 2.3 | 0.6 | 3.3 | 0.5 | 30.8 | 2.1 | 0.6 | 3.7 | 0.5 | 31.6 | 13 | |||||
| 26% attributable to Exxaro2 | Inferred resources inside LoMP | ||||||||||||||||
| Gamsberg North mine | 13 | Proved | 44.5 | 6.8 | 0.5 | 44.5 | 6.8 | 0.5 | 0 |
||||||||
| Northern Cape | Probable | 8.7 | 6.0 | 0.5 | 8.7 | 6.0 | 0.5 | 0 | |||||||||
| (OC) (zinc) | Total | 53.2 | 6.6 | 0.5 | 53.2 | 6.6 | 0.5 | 0 | |||||||||
| 26% attributable to Exxaro2 | Inferred resources inside LoMP | 0.4 | |||||||||||||||
1 Operation refers to Black Mountain Mining operating mine or significant project. Mining method: OC - opencut, UG - underground
2 Figures are reported at 100% irrespective of percentage attributable to Exxaro
3 The increase is primarily due to design changes of longhole stopping as well as implementation of additional stopes and declines