Integrated report 2019
Exxaro Resources Limited
Environmental, social and governance report
A steering committee oversees energy management projects and activities, and ensures alignment with Exxaro’s carbon-emission reduction.
A clear understanding of the risks and opportunities is thus understood in the broader sense, and this enables operations to focus on managing energy consumption, carbon emissions and other climate change-related issues.
We continue to improve our energy and carbon measurement, data management, accounting and reporting in terms of the Greenhouse Gas Protocol, and reporting our scope 1, 2 and 3 emissions through the CDP. We have elected to use the operating control accounting approach in reporting emissions.
| Scope 1 | Direct greenhouse gas (GHG) emissions (measured in tCO2e) from sources owned or controlled by Exxaro using diesel, petrol, gas and anthracite combustion in day-to-day mining operations |
| Scope 2 | GHG emissions from electricity generated by Eskom and purchased by Exxaro |
| Scope 3 | Emissions outside our control but emanating from our products or activities such as customers burning coal sold by Exxaro |
The Greenhouse Gas Protocol provides a common measurement platform to compare aggregate data nationally and internationally. South Africa, which has set arguably the most aggressive carbon abatement targets of any developing country, aims to reduce emissions by 34% below business as usual by 2020 and 42% by 2025.
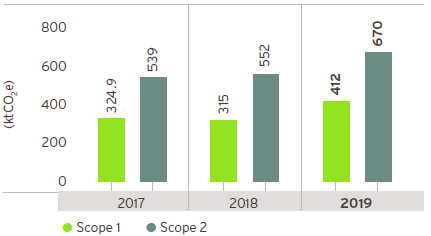
GHG emissions
| ktCO2e | 2019 | 2018 | 2017 | ||
|---|---|---|---|---|---|
| Scope 1 | 412 | 315 | 324.9 | ||
| Scope 21 | 670 | 552 | 539 | ||
| Total scope 1 and 2 | 1 082 | 867 | 864 | ||
| Year-on-year change (%) | 24.8 | 0.4 | 4.9 | ||
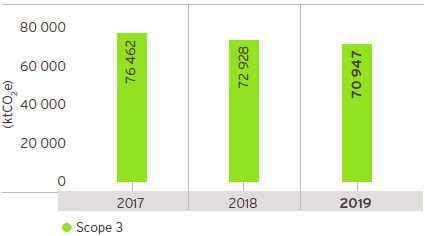
| Scope 32 | 70 947 | 72 928 | 76 462 | ||
| Year-on-year change (%) | 2.7 | 4.6 | 2.7 |
1 Scope 2: Electricity-based emissions are derived from the grid emission factor for South Africa (1.06tCO2e/MWh)
2 Scope 3: Reported emissions based on use of product sold by Exxaro (represent over 95% of Exxaro’s scope 3 emissions)
| GHG emissions | Scope 3 | |
 |
 |
| Carbon emissions by source | |||||
| ktCO2e | 2019 | 2018 | 2017 | ||
|---|---|---|---|---|---|
| Electricity | 670 | 552 | 539 | ||
| Year-on-year change (%) | 18 | 2.4 | 7.5 | ||
| Source proportion (%) | 61.9 | 64 | 62 | ||
| Diesel | 267.5 | 217.5 | 211.3 | ||
| Year-on-year change (%) | 19 | 2.9 | 25 | ||
| Source proportion (%) | 24.7 | 25 | 24 | ||
| Fugitive emissions | 135.9 | 93 | 94.6 | ||
| Year-on-year change (%) | 32 | 1.7 | 11 | ||
| Source proportion (%) | 12.6 | 11 | 11 | ||
| Other sources | 8.6 | 0.3 | 18.6 | ||
| Year-on-year change (%) | 96 | 74 | 80 | ||
| Source proportion (%) | 0.8 | 0.6 | 3 |
The CDP is a UK-based organisation that runs a global environmental disclosure system. The data provides valuable insights into corporate strategies and the journey towards environmental leadership. Furthermore, this helps channel investment to companies adhering to sustainable carbon and emissions management.
Since 2008, Exxaro has participated in the CDP Climate Change programme. To support our reporting in terms of this programme, we manage a central data repository that records information on our energy consumption and intensity, carbon emissions measurement and cost performance at business unit and group levels. The database is audited and assured externally every year. We have also participated in the CDP Water programme since 2010.
Reducing our energy consumption and improving our energy efficiency remains top priority. To this end, we remain focused on lowering Exxaro’s carbon footprint. Given the fast-changing legislative environment and the promulgation of the carbon tax from 1 June 2019, reducing GHGs is a business imperative as it could affect our financial performance.
GHG emissions (tCO2e) in 2019
| Business unit | Scope 1 | Scope 2 | Scope 3 | Total | |
|---|---|---|---|---|---|
| Mpumalanga | |||||
| Arnot | 2.5 | 14.7 | 0 | 17.2 | |
| Belfast | 19.7 | 0.032 | 156.4 | 176.1 | |
| Dorstfontein East | 32.5 | 19.3 | 1690 | 1742 | |
| Dorstfontein West | 8.9 | 19.1 | 487 | 515.6 | |
| Forzando North | 5.1 | 50.4 | 0 | 55.5 | |
| Forzando South | 10.9 | 0 | 301 | 312 | |
| Leeuwpan | 84 | 28 | 6054.6 | 6166.7 | |
| Mafube | 21.8 | 25.4 | 3119 | 3166 | |
| Matla | 35.1 | 109.2 | 10894.5 | 11038.8 | |
| Limpopo | |||||
| Reductants | 0 | 0 | 57.9 | 57.9 | |
| Grootegeluk | 191.3 | 394.5 | 48185.7 | 48771.5 | |
| Tshikondeni | 0.04 | 1.96 | 0 | 2 | |
| Gauteng | |||||
| Exxaro Corporate Centre | 0.001 | 3.3 | 0 | 3.3 | |
| FerroAlloys | 0 | 4.3 | 0 | 4.3 | |
| KwaZulu-Natal | |||||
| Durnacol | 0.042 | 0.082 | 0 | 0.12 | |
| Hlobane | 0.15 | 0.015 | 0 | 0.16 |