Integrated report 2019
Exxaro Resources Limited
Environmental, social and governance report
Our primary sources of energy for our business units in 2019 were diesel (25%) and electricity (62%). In 2018, the primary sources of energy were also diesel and electricity (59% and 41% respectively). Total energy consumed increased by 4% in 2019 to 5 179 561GJ, compared to 4 977 270GJ in 2018. The increase was mainly due to the inclusion of our ECC operations in the 2019 reporting period.
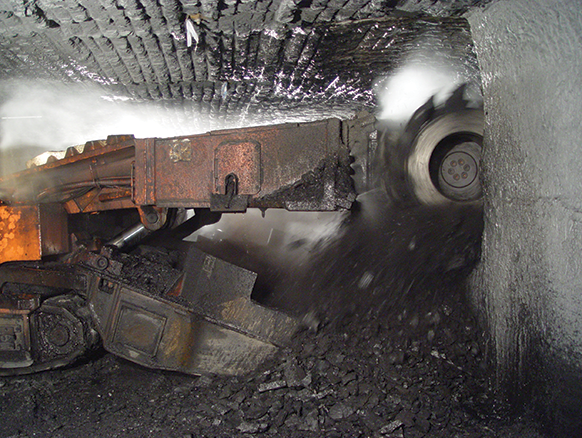
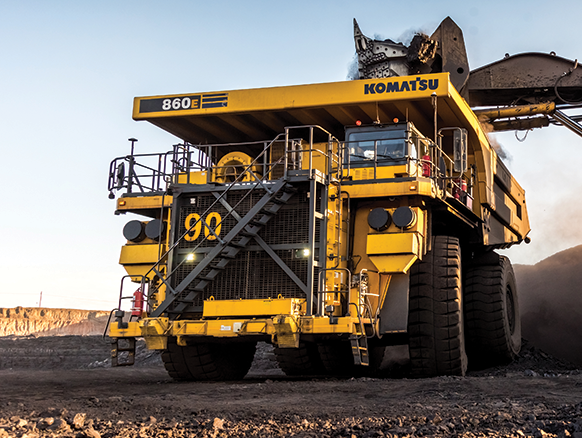
As part of Exxaro's energy and carbon management programme, our coal operations have focused on reducing energy consumption, including projects to specifically increase the efficiency of diesel and electricity consumption. Our technology and engineering departments initiated projects to reduce diesel consumption at all our operations, including the use of fuel additives and payload management. Future projects include developing a consolidated dashboard for fuel and electricity at various business units.
We believe all of these initiatives will support the transition of our operations to greater energy efficiency, characterised by low carbon footprints and optimised energy consumption.
We set energy intensity targets every year, based on the performance of each operation over the previous two years, and these targets are monitored monthly. Following a review of the targets at the end of 2017, we proposed long-term (five-year) targets to facilitate our energy saving initiatives. Exxaro implemented these targets during the second half of 2019.
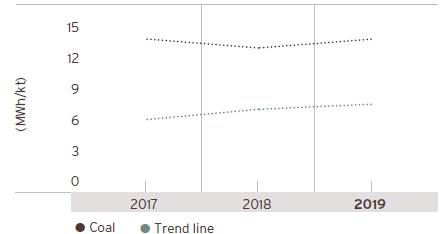
Electricity and diesel intensities increased in 2019, mainly due to the inclusion of additional operations such as Belfast and the Exxaro Coal Central (ECC) operations (Dorstfontein West, Dorstfontein East, Forzando North and Forzando South). Based on production tonnes in 2019, electricity intensity increased by 6% to 13.8MWh/kt while the diesel intensity increased by 19% to 2 183l/kt.
Electricity consumption at coal operations
| Electricity (MWh) | Production (kt) | Electricity intensity (MWh/kt) | ||||||||||||||||
| 2019 | 2018 | 2017 | 2019 | 2018 | 2017 | 2019 | 2018 | 2017 | ||||||||||
|---|---|---|---|---|---|---|---|---|---|---|---|---|---|---|---|---|---|---|
| Coal | 625 211 | 543 178 | 527 688 | 45 214 | 41 952 | 39 312 | 13.8 | 12.95 | 13.83 | |||||||||
| Change (%) | 15 | 3 | 1.8 | 7 | 6 | 6 | 6 | 7 | 7.5 | |||||||||
| Arnot | 13 901 | 22 041 | 26 967 | 0 | 0 | 0 | 0 | 0 | 0 | |||||||||
| Reductants | 0 | 0 | 0 | 0 | 0 | 86 | 0 | 0 | 0 | |||||||||
| Durnacol | 76.9 | 107 | 99 | 0 | 0 | 0 | 0 | 0 | 0 | |||||||||
| Grootegeluk | 372 148.5 | 381 480 | 358 101 | 27 757 | 29 698 | 25 538 | 13.4 | 12.85 | 14.02 | |||||||||
| Hlobane | 13.8 | 16 | 21 | 0 | 0 | 0 | 0 | 0 | 0 | |||||||||
| Leeuwpan | 26 434.7 | 26 225 | 25 242 | 4 396 | 4 220 | 3 355 | 6 | 6.21 | 7.52 | |||||||||
| Matla | 103 037.4 | 105 757 | 107 467 | 5 991 | 6 609 | 7 400 | 17.2 | 16 | 14.52 | |||||||||
| North Block Complex | 0 | 6 000 | 7 757 | 0 | 1 425 | 2 665 | 0 | 4.21 | 2.9 | |||||||||
| Tshikondeni | 1 849.2 | 1 550 | 2 034 | 0 | 0 | 0 | 0 | 0 | 0 | |||||||||
| Forzando North | 47 510.6 | 402.8 | 23 | |||||||||||||||
| Forzando South1 | 0 | 1 671 | ||||||||||||||||
| Dorstfontein West | 18 013.2 | 816 | 22 | |||||||||||||||
| Dorstfontein East | 18 254.2 | 1 345 | 13.6 | |||||||||||||||
| Belfast | 30.1 | 1 029 | 0.03 | |||||||||||||||
| 1 | Electricity consumption at Forzando South is included in the Forzando North figure (consumption is for Forzando North and Forzando South hence the calculated electricity intensity reflected for Forzando North is based on production figures for both operations). |
Electricity intensity
Diesel consumption at coal operations
| Diesel (kL) | Production (kt) | Diesel consumption intensity (L/kt) |
||||||||||||||||
| 2019 | 2018 | 2017 | 2019 | 2018 | 2017 | 2019 | 2018 | 2017 | ||||||||||
|---|---|---|---|---|---|---|---|---|---|---|---|---|---|---|---|---|---|---|
| Coal | 98 702 | 73 926 | 72 101 | 45 214 | 41 952 | 39 312 | 2 183 | 1 762 | 1 655 | |||||||||
| Change (%) | 25 | 1 | 10.8 | 7 | 6 | 6 | 19 | 6 | (5.8) | |||||||||
| Arnot | 902 | 989 | 1 311 | 0 | 0 | 0 | 0 | 0 | 0 | |||||||||
| Reductants | 0 | 118 | 79 | 0 | 0 | 56 | 0 | 0 | 1 411 | |||||||||
| Durnacol | 13 | 27 | 25 | 0 | 0 | 0 | 0 | 0 | 0 | |||||||||
| Grootegeluk | 50 720 | 41 940 | 40 486 | 27 757 | 29 697 | 25 538 | 1 827 | 1 412 | 1 599 | |||||||||
| Hlobane | 52 | 33 | 40 | 0 | 0 | 0 | 0 | 0 | 0 | |||||||||
| Leeuwpan | 21 924 | 16 625 | 16 768 | 4 396 | 4 220 | 3 355 | 4 987 | 4 618 | 4 998 | |||||||||
| Matla | 2 194 | 2 503 | 2 550 | 5 991 | 6 609 | 7 400 | 366 | 379 | 345 | |||||||||
| North Block Complex | 0 | 8 609 | 10 462 | 0 | 1 425 | 2 962 | 0 | 6 041 | 3 956 | |||||||||
| Tshikondeni | 13.7 | 8 | 22 | 0 | 0 | 0 | 0 | 0 | 0 | |||||||||
| Forzando North | 813.9 | 402.8 | 2 020 | |||||||||||||||
| Forzando South | 218.7 | 1 671 | 130 | |||||||||||||||
| Dorstfontein West | 463.9 | 816 | 568.5 | |||||||||||||||
| Dorstfontein East | 9 598 | 1 345 | 7 136 | |||||||||||||||
| Belfast | 5 020 | 1 029 | 4 879 | |||||||||||||||