


Despite logistical constraints, cost pressures and lower coal pricing, our coal performance remains strong in delivering value to stakeholders through our early value strategy, coupled with our market to resource optimisation initiatives. Our Cennergi operations delivered a stable performance with generation back to normal levels.
Riaan Koppeschaar
Finance director

Following our record performance in 2022 resulting from high commodity prices, the tougher conditions we experienced in 2023 resulted in a 29% decrease in EBITDA to R13.4 billion. The contribution from our non-controlled operations showed a decrease in adjusted* equity-accounted income by 4% to R7.0 billion. Adjusted equity-accounted income of SIOC increased by 26% to R6.2 billion, which was more than offset by a weaker performance from Mafube (our 50% joint venture with Thungela). This translated into basic headline earnings per share of R46.81 compared to R60.16 in 2022. We are pleased to have declared a final ordinary dividend to shareholders of R10.10 per share. The board also declared a special dividend of R5.72 per share bringing the total dividend for the year to R27.25 per share.

Revenue of
down 17%
Cash generated by
operations of
down 29%
EBITDA** of
down 29%
Final ordinary dividend
declared of R10.10 per
share down 11%
Adjusted* equity-accounted
income of R7.0 billion
down 4%
Special dividend declared
of R5.72 per share
Headline earnings of
R46.81 per share
down 22%
Attributable earnings of
R46.66 per share
down 18%
| * | Adjusted for non-core items (headline earnings adjustments). |
| ** | EBITDA is calculated by adjusting net operating profit before tax with depreciation, amortisation, impairment charges or impairment reversals and net losses or gains on disposal of assets and investments (including translation differences recycled to profit or loss). |
2023 was characterised by declining coal prices due to a decrease in high calorific value coal demand, driven by sufficient gas and coal stocks in Europe, Japan, Korea and Taiwan. The reduction in coal demand was exacerbated by warmer than usual winter temperatures, robust performance in renewable and nuclear energy generation, and significantly lower gas prices.
We also saw a resurgence in Indian demand compared to the 2022 financial year due to lower coal prices. There were visible changes in global trade flows as Australia resumed supply into China from a previous trade ban, and Russian supplies to Europe and Japan reduced drastically, with Korea adopting a gradual approach of weaning itself off Russian coal.
China and India's economic growth and buoyant power demand were the main demand drivers for coal.
Domestically, operational challenges and equipment failures at Eskom's power stations impacted the offtake of power station coal in the Waterberg region. The operating environment for domestic coal end-users was challenging in the 2023 financial year due to loadshedding, logistical challenges, slowing growth and inflationary pressures.
The benchmark API4 RBCT export price averaged US$121 per tonne (2022: US$271). The group realised an average export price of US$117 per tonne (2022: US$251). Despite this price decline, Exxaro was able to realise 97% of the average API4 index price based on our sales mix. Export volumes decreased slightly to 5.1Mt (2022: 5.2Mt).
For a better understanding of the comparability of results between the two reporting periods, we have adjusted our financial results for non-recurring items (referred to as non-core adjustments) to derive our adjusted financial results. The non-core adjustments in 2023 and 2022 are the same as the headline earnings adjustments.
The group performance highlights should be read in conjunction with the group (consolidated) annual financial statements as at the year ended 31 December 2023.
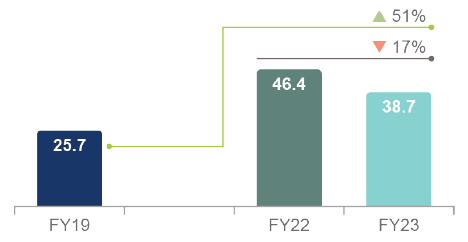
Revenue
R billion
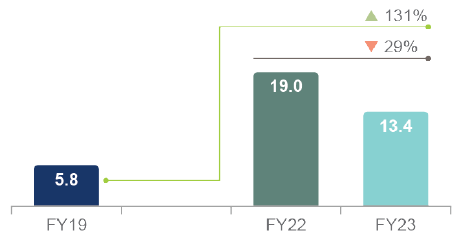
EBITDA
R billion
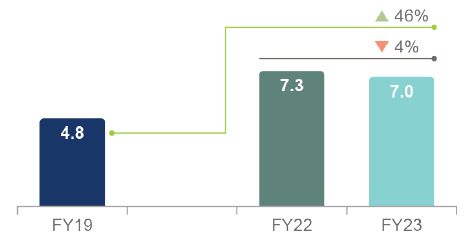
Equity income
R billion
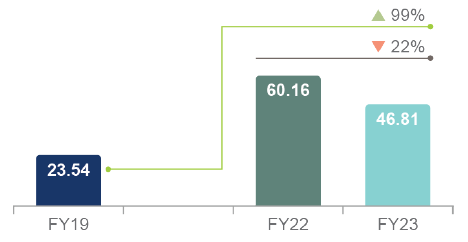
HEPS
R/share
Cash generated
R billion
Net (debt)/cash
R billion
Group revenue decreased by 17% to R38 698 million (2022: R46 369 million), mainly driven by significantly lower export sales prices due to the steep decline in the API4 index price, partially offset by a weaker exchange rate and higher prices achieved on domestic sales at our coal operations.
The revenue contribution from our energy operations was 16% higher than 2022. Energy generation from the Cennergi operating wind assets was higher, driven by improved wind conditions compared to the prior year.
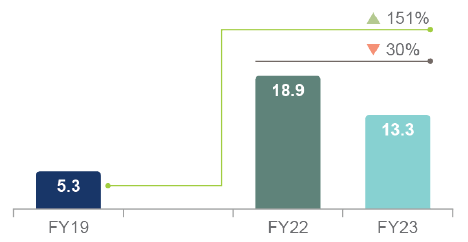
Group EBITDA decreased by 29% to R13 399 million (2022: R19 001 million). The main drivers for the decrease are provided in the graph below.
Group EBITDA (Rm)
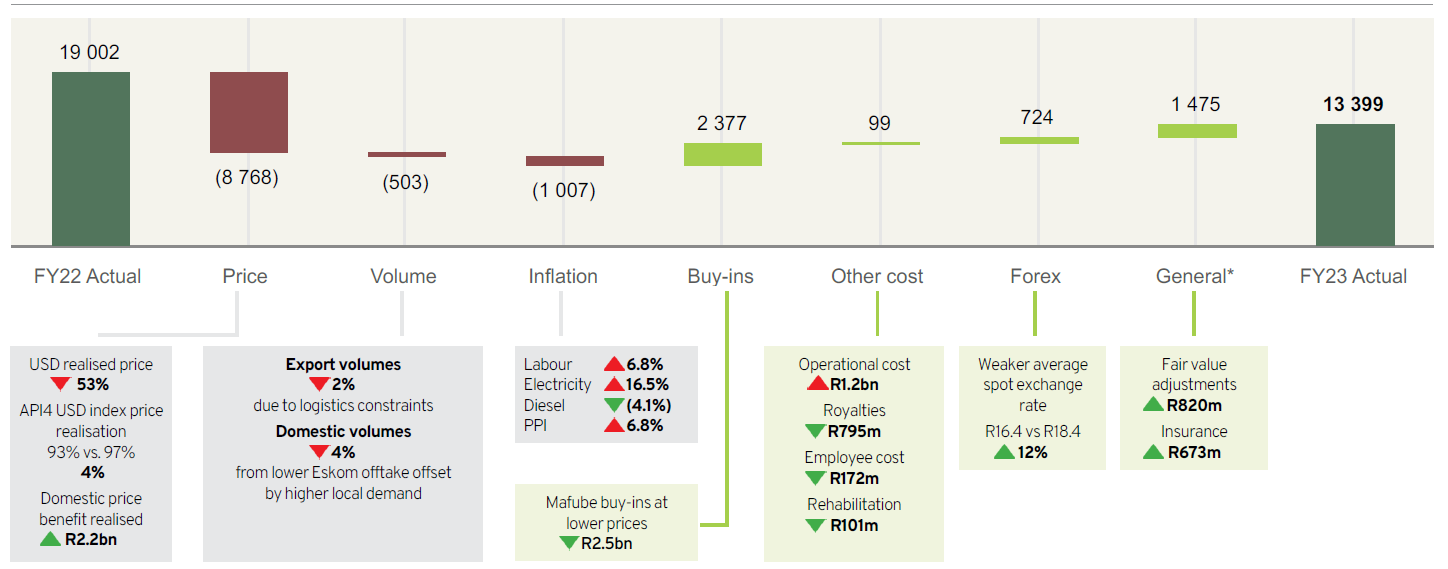
The lower prices realised in 2023 were mainly driven by the lower benchmark API4 price resulting in an average realised price on our export sales of US$117 per tonne, a 53% decrease compared to 2022. This was partially offset by a higher price realisation compared to the benchmark API4 price of 4% due to our high-quality sales mix, as well as higher prices realised in the domestic market.
As a result of the ongoing logistical challenges, our export volumes decreased by 2%. To mitigate the poor rail performance, export coal was transported to alternative export ports using road transport and some coal was sold in the domestic market. Domestically, operational challenges and equipment failures at Eskom's power stations impacted the offtake of power station coal in the Waterberg region.
We also experienced inflationary pressure with electricity costs increasing by 16.5%, labour costs increasing by 6.8% and the rest of our costs increasing at PPI of 6.8%. There was some relief as our diesel costs decreased by 4%.
The cost of our buy-ins from our Mafube joint venture was lower, directly related to the lower API4 benchmark price in 2023 compared to 2022.
The increase in operational costs was mainly due to once-off overburden removal at Leeuwpan, Belfast and Grootegeluk, enhanced maintenance efforts in line with schedules and equipment hire, and higher production volumes at Leeuwpan and Belfast.
Royalties decreased in line with lower revenue.
Employee costs, including incentive payments, were lower in line with lower profitability and performance targets not being met.
The net decrease in rehabilitation cost is due to the impact of external surveys performed at our operations, combined with a favourable movement in discount rates in 2023, partially offset by an increase in the water treatment cost at our mines in closure to curb the impact of decanting.
The net positive foreign currency exchange variance is due to the impact of the weaker ZAR/USD exchange rate on revenue as well as realised and unrealised foreign currency exchange differences on foreign trade receivables and cash balances.
Included under general expenses are fair value adjustment gains on foreign exchange contracts, environmental rehabilitation funds, and funds held in our insurance portfolio.
Adjusted equity-accounted income from associates and joint ventures decreased by 4% to R6 991 million (2022: R7 303 million).
| Adjusted equity-accounted income/(loss) |
Dividends received | |||||
| |
2023 Rm |
2022 Rm |
Change % |
2023 Rm |
2022 Rm |
Change % |
| Coal: Mafube | 510 | 1 902 | (73) | 1 525 | 750 | 103 |
|---|---|---|---|---|---|---|
| Coal: RBCT | (8) | (9) | 11 | |
|
|
| Ferrous: SIOC | 6 157 | 4 902 | 26 | 3 386 | 5 153 | (34) |
| Other: Black Mountain | 332 | 578 | (43) | |
|
|
| Other: LightApp | |
(70) | |
|
||
| Total | 6 991 | 7 303 | (4) | 4 911 | 5 903 | (17) |
The 26% increase in adjusted equity-accounted income from SIOC to R6 157 million (2022: R4 902 million) was driven by higher iron ore prices and sales volumes as well as cost optimisation initiatives. This was offset by a 73% decrease in Mafube's adjusted equity-accounted income, mainly due to lower export prices.
SIOC declared a final dividend to its shareholders in February 2024. Exxaro's share of the dividend amounts to R2 107 million, which is 7% higher than the interim dividend received. The dividend will be accounted for in the first half of 2024.
Group headline earnings decreased by 22% to R11 327 million (2022: R14 558 million), driven by the 29% decrease in group EBITDA and 4% decrease in adjusted equity-accounted income.
The weighted average number of shares of 242 million remained unchanged, translating into headline earnings per share of 4 681 cents per share (2022: 6 016 cents per share).
In terms of our capital allocation framework, free cash flow generated will be prioritised per the diagram below:
The diagram represents the order of our capital allocation framework. In applying our capital allocation framework, we aim for a gearing ratio of below 1.5 times net debt (excluding ring-fenced project financing) to EBITDA. The capital allocation framework is in line with our commitment to sustainably return cash to shareholders through the cycle while retaining a strong financial position.
During 2023, we had cash inflows of R16.1 billion (2022: R20.4 billion), comprising R10.7 billion from our operations net of tax paid (2022: R14.7 billion) and dividend income received from our equity-accounted investments of R4.9 billion (2022: R5.9 billion) as well as net interest received of R0.4 billion (2022: R0.3 billion net interest paid) on our cash and cash equivalents.
In terms of our capital allocation framework, we used this cash to:
Given our net cash position (excluding ring-fenced project financing) at 31 December 2023 and 31 December 2022, our net debt to EBITDA cover ratio was well below our target of 1.5.
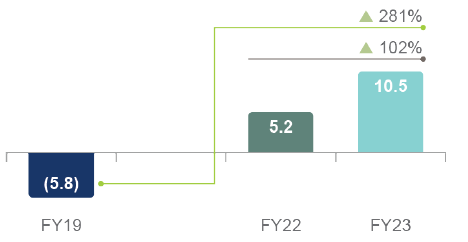
Exxaro remains in a strong liquidity position with a net cash balance of R10.5 billion as at 31 December 2023 (2022: R5.2 billion) and undrawn borrowing facilities and maturities as set out below. If the energy net debt is excluded, the net cash position at 31 December 2023 was R14.8 billion (2022: R9.6 billion).
| Facilities available | ||||||
| Drawn Rm |
Undrawn/ committed Rm |
Undrawn/ unissued Rm |
Maturity profile of debt | |||
| EXXARO | ||||||
| Term loan and revolving facility | 3 400 | 3 250 | |
Repayment period | 4 487 | |
|---|---|---|---|---|---|---|
| Domestic Medium-Term Note programme | 643 | 4 000 | Less than 6 months | 954 | ||
| Interest-bearing borrowings | 4 043 | |
|
6 – 12 months | 248 | |
| Interest capitalised | 64 | |
|
1 – 2 years | 507 | |
| Lease liabilities | 389 | |
|
2 – 3 years | 2 574 | |
| Capitalised transaction costs | (9) | |
|
3 – 4 years | 80 | |
| Total interest-bearing debt | 4 487 | |
|
4 – 5 years | 97 | |
| Current | 1 202 | |
|
>5 years | 27 | |
| Non-current | 3 285 | |
|
|
|
|
| Net cash and cash equivalents | (19 321) | |
|
|
|
|
| Net cash | (14 834) | |
|
|
|
|
| ENERGY | |||||
| Project financing | 4 833 | 1 267 | Repayment period | 4 887 | |
|---|---|---|---|---|---|
| Interest-bearing borrowings | 4 833 | |
Less than 6 months | 144 | |
| Interest capitalised | 5 | 6 – 12 months | 148 | ||
| Lease liabilities | 62 | 1 – 2 years | 349 | ||
| Capitalised transaction costs | (13) | 2 – 3 years | 450 | ||
| Total interest-bearing debt | 4 887 | 3 – 4 years | 557 | ||
| Net cash and cash equivalents | (538) | 4 – 5 years | 683 | ||
| Net debt | 4 349 | >5 years | 2 556 | ||
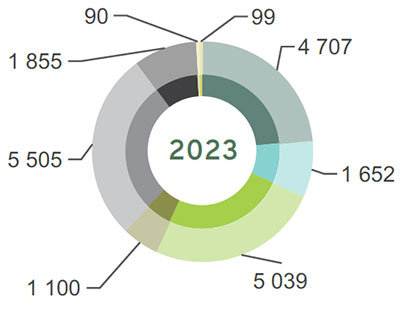
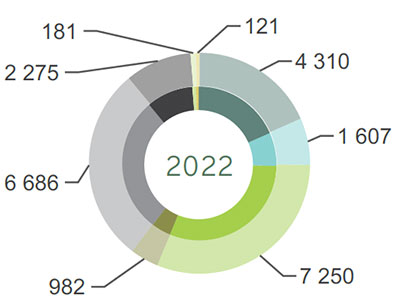
We distribute the value we generate to our stakeholders as follows:
All stakeholders benefit from continuous reinvestment into the group to ensure sustainability and expansion.
As part of the broader Exxaro strategic review, we continuously seek opportunities to unlock value to support our Sustainable Growth and Impact strategy. As previously reported, Exxaro identified that the FerroAlloys business is no longer a strategic fit within our envisaged minerals business portfolio and a sales process has commenced to dispose of our entire shareholding in Exxaro FerroAlloys Proprietary Limited. Exxaro aims to enhance the economic participation of black-owned companies in the South African economy. In line with this intent, we earmarked the FerroAlloys disposal process to target black ownership.
As we are still in the initial stages of the sales process, the investment did not meet all the criteria to be classified as a non-current asset held-for-sale on 31 December 2023.
Despite the operational challenges experienced in 2023, all internal KPIs are well within target, indicating a healthy balance sheet and strong cash flow generation. The impact of various coal sensitivity measures as well as the key financial risk factors can be further used to stress test our current headroom. Exxaro complied with all the bank covenants for the year ended 31 December 2023.
Refer to note 12.1.4 of the group annual financial statements for the year ended 31 December 2023 for detailed disclosure on the salient terms and conditions of interest bearing borrowings.
The following diagram indicates key sensitivities on the coal net operating profit:
| Measure | Sensitivity | Net operating profit impact |
| Environmental rehabilitation discount rate decrease | 1% | (169) |
| Environmental rehabilitation discount rate increase | 1% | 156 |
| Royalty cost | 1% | 369 |
| Production cost | 1% | 189 |
| Domestic sales volumes | 1% | 153 |
| Export price per tonne | US$1 | 94 |
| Export sales volumes | 1% | 56 |
| Exchange rate | 10 cents | 52 |
| Labour | 1% | 32 |
| Railage | 1% | 31 |
| Fuel | 1% | 16 |
| Energy | 1% | 8 |
Our strategic treasury function predominantly provides financial risk management services to the business, coordinates access to domestic and international financial markets, and monitors and manages operational financial risks through internal risk reports that analyse exposure by degree and magnitude of risks. These risks include market risk (including foreign currency risk, interest rate risk and price risk), credit risk and liquidity risk.
In managing our capital, we focus on a sound net debt position, return on shareholders' equity (or return on capital employed) and the level of dividends to shareholders. Our policy is to cover annual net funding requirements through long-term loan facilities with maturities spread over time. Neither Exxaro nor any of our subsidiaries are subject to externally imposed capital requirements.
Market risk is the risk that changes in market prices (such as foreign exchange rates, interest rates and equity prices) will affect profit or the value of its holdings of financial instruments. The objective of market risk management is to manage and control market risk exposure within acceptable parameters while optimising the return on risk.
Our activities expose us primarily to the financial risks of changes in environmental rehabilitation funds, portfolio investment and deposit facilities quoted prices, foreign currency exchange rates and interest rates. We enter into a variety of derivative financial instruments to manage our exposure to foreign currency risk and interest rate risks, including:
Our exposure to equity price risk arises from investments held by and classified as "at fair value through other comprehensive income" or "at fair value through profit or loss". Our exposure to price risk in relation to quoted prices of environmental rehabilitation funds, portfolio investments and deposit facilities is not considered a significant risk as the funds are invested with reputable financial institutions in accordance with a strict mandate to ensure capital preservation and growth. The funds are held for strategic purposes rather than trading purposes.
Certain transactions are denominated in foreign currencies, hence exposures to exchange rate fluctuations arise. The currency in which transactions are entered into is denominated in US dollar, euro and Australian dollar. Exchange rate exposures are managed within approved policy parameters using foreign exchange contracts, currency options and currency swap agreements.
We maintain a fully covered exchange rate position in respect of foreign balances (if any) and imported capital equipment, resulting in these exposures being fully converted to rand. Trade-related import exposures are managed through using economic hedges arising from export revenue and foreign exchange contracts. Trade-related export exposures are hedged using foreign exchange contracts and currency options focusing on short-term receivables. Any open exposure to foreign currency risk on these balances is insignificant as the turnaround time is generally less than 30 days. Foreign-denominated capital purchases funded by rand-denominated project financing arrangements are hedged using foreign exchange contracts.
Monetary items are translated at the closing rate at the last day of the reporting period.
The foreign exchange contracts used to hedge foreign currency exposure mostly have a maturity of less than one year from the reporting date. When necessary, foreign exchange contracts are rolled over at maturity.
Refer to note 16.3.3.2.2 of the group annual financial statements for the year ended 31 December 2023 for detailed disclosure.
We are exposed to interest rate risk as we borrow and deposit funds at floating interest rates on the money market and extended bank borrowings. Our main interest rate risk arises from long-term borrowings with floating rates, which expose us to cash flow interest rate risk. The risk is managed by undertaking controlled management of the interest structures of the investments and borrowings, maintaining an appropriate mix between fixed and floating interest rate facilities in line with the interest rate expectations. We also use interest rate swaps and interest rate forwards to manage the interest rate risk exposure.
When the contractual terms of the borrowings and covenants thereof require the use of hedging instruments to mitigate the risk of fluctuations of the underlying interest rate risk cash flow exposure and the impact on profit or loss of specific projects being financed, we look to apply hedge accounting where an effective hedge relationship is expected and to the extent that such exposure poses a real risk to the achievement of the loan covenants.
The financial institutions chosen are subject to compliance with the relevant regulatory bodies.
Refer to note 16.3.3.2.3.1 of the group annual financial statements for the year ended 31 December 2023 for detailed disclosure.
The group is exposed to the risk of variability in future interest payments on project financing, attributable to fluctuations in three-month Johannesburg Interbank Average Rate during operations phase, and one-month Johannesburg Interbank Average Rate during construction phase. The designated hedged item is the group of expected floating interest rate cash flows arising from the project financing, up to the notional amount of each interest rate swap, over the term of the hedging relationship. The notional amounts per interest rate swap match up to the designated exposure being hedged.
Where all relevant criteria are met, hedge accounting is applied to remove the accounting mismatch between the hedging instrument and the hedged item. This will effectively result in recognising interest expense at a fixed interest rate for the hedged project financing.
Refer to note 16.3.3.2.3.2 of the group annual financial statements for the year ended 31 December 2023 for detailed disclosure.
Liquidity risk is the risk that we will not be able to meet our financial obligations as they fall due. Our approach to managing liquidity is to ensure, as far as possible, that we will always have sufficient liquidity to meet our liabilities when due, under normal and stressed conditions, without incurring unacceptable losses or risking damage to our reputation.
The ultimate responsibility for liquidity risk management rests with the board, which has built an appropriate liquidity risk management framework for managing Exxaro's short, medium, and long-term funding and liquidity management requirements. We manage liquidity risk by monitoring forecast cash flows in compliance with loan covenants and ensuring that adequate unutilised borrowing facilities are maintained.
| Group | ||
| 2023 Rm |
2022 Rm |
|
| Amount approved | 65 309 | 58 524 |
|---|---|---|
| Total borrowings | (8 923) | (9 093) |
| Unutilised borrowing capacity | 56 386 | 49 431 |
Exxaro's capital base, the borrowing powers of the company and the group were set at 125% of shareholders' funds for both the 2023 and 2022 financial years. To avoid incurring interest on late payments, financial risk management policies and procedures are entrenched to ensure the timeous matching of orders placed with goods received notes or services acceptances and invoices.
Credit risk relates to potential default by counterparties on cash and cash equivalents, loans, investments, trade receivables and other receivables.
We limit our counterparty exposure arising from money market and derivative instruments by only dealing with well-established financial institutions of high credit standing. Our exposure and the credit ratings of our counterparties are continuously monitored, and the aggregate value of transactions concluded are spread among approved counterparties. Credit exposure is controlled by counterparty limits that are reviewed and approved by the board annually.
Trade receivables consist of several customers with whom Exxaro has long-standing relationships. A high portion of term supply arrangements exists with such customers, resulting in limited credit exposure (which exposure is limited by performing customer creditworthiness or country risk assessment).
Exxaro strives to enter into sales contracts with customers, which stipulate the required payment terms. It is expected of each customer that these payment terms are adhered to. Where trade receivable balances become past due, the normal recovery procedures are followed to recover the debt, where applicable new payment terms may be arranged to ensure that the debt is fully recovered.
Exxaro has concentration risk due to our exposure to one major customer. This is, however, not considered significant as the customer adheres to the stipulated payment terms. We establish an allowance for non-recoverability or impairment that represents our estimate of expected credit losses in respect of trade receivables, other receivables, loans, cash and cash equivalents, and investments.
Refer to note 16.3.3.4.1 of the group annual financial statements for the year ended 31 December 2023 for detailed disclosure.
Global inflation is expected to continue its downward path, although towards the end of 2023, energy-related pressures temporarily stalled this trajectory. As a result, policy interest rates are predicted to remain restrictive for longer, affecting both global investment sentiment and economic activity.
Despite unprecedented rolling loadshedding, South Africa's real GDP grew by 0.9% year on year in the first six months of 2023.The modest upside reflected higher investment in machinery and other equipment and a better-than-expected response to loadshedding. However, GDP decreased by 0.2% in the third quarter of 2023. The ongoing constraints of inadequate electricity and logistic challenges limit the local economy's future productive potential.
During 2023, the South African rand lost significant value against major global currencies. This is attributable to intensified loadshedding with the perceived risk of a potential grid collapse, the country's grey listing by the Financial Action Task Force, widening current-account and fiscal deficits, US dollar strength, global recessionary risk, and widespread geopolitical tensions. We expect the USD/ZAR exchange rate to improve in 2024 due to an expected improvement in both global economic sentiment and investor confidence.
Despite the uncertainty of the severity of the northern hemisphere's winter and potential risks around natural gas availability and prices, continued strong Chinese thermal coal imports are expected to provide some support to seaborne thermal coal prices. However, the easing of global supply risks in both the thermal coal and natural gas (including liquefied natural gas) markets are expected to filter through to market pricing.
Continuous rising iron ore supply and exports remain the limiting factor for iron ore prices. Supply increases from major miners, a flat Chinese demand, with the rest of the world demand recovering are expected in 2024. A stronger pricing environment is expected to prevail, supported by higher marginal cost levels.
TFR railed 47.92Mt of coal to the Richards Bay Coal Terminal from January to December 2023. The export rail performance remains below expectations due to the impact of security, vandalism, and locomotive shortages.
Riaan Koppeschaar
Finance director
10 April 2024