Exxaro Resources limited
Consolidated Mineral Resources and Mineral Reserves report 2021
The reported Mineral Resources and Mineral Reserves remaining as at 31 December 2021 are indicated in this section. Mineral Resource and Mineral Reserve figures are not an inventory of all mineral occurrences drilled or sampled but a realistic record of those, under assumed and justifiable technical and economic conditions, that may be economically extractable currently and in future.
Mineral Resources and Mineral Reserves are reported inclusive of Mineral Resources that have been converted to Mineral Reserves. An exception is reporting for Gamsberg and Black Mountain Mining (BMM) because figures received from Vedanta Resources (JORC Code) represent Mineral Resources excluding Mineral Resources converted to Mineral Reserves.
In addition, we provide Resource estimates within LoMP and insight into all applicable modifying factors. Exxaro includes all estimates directly under its management control and estimates of entities in which Exxaro holds a 25% interest or larger. Mineral Resources and Mineral Reserves are reported at 100% irrespective of the percentage attributable to Exxaro.
Explanations for material changes in year-on-year movements are provided as footnotes in the Mineral Resources and Mineral Reserves tables.
| Commodity: Coal | Category | 2021 MTIS (Mt) |
| Exxaro attributable tonnes | Measured | 3 831 |
|---|---|---|
| Indicated | 2 422 | |
| Inferred | 3 342 | |
| Total Coal Resources | 9 595 | |
| Proved | 1 897 | |
| Probable | 1 083 | |
| Total Coal Reserves | 2 980 |
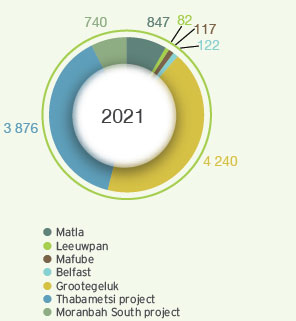
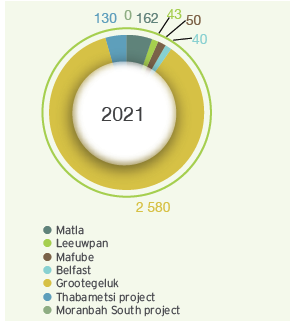
Figure 6: Exxaro's Coal Resource and Coal Reserve attributable contribution
Resource contribution
Reserve contribution
The table below details the total inclusive Coal Resources estimated as at 31 December 2021.
Table 9: Coal Resources and qualities
| 2021 | 2020 | % change in tonnes5 |
|||||||||||||
| Tonnes and quality4 | Tonnes and quality4 | ||||||||||||||
| Operation1 | Location3 | Resource category |
Tonnes (Mt) |
CV MJ/kg | % Ash |
% IM |
% VM |
% S |
Tonnes (Mt) |
CV MJ/kg |
% Ash |
% IM |
% VM |
% S |
|
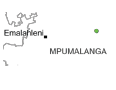
| Matla mine6 (UG) (captive market) Mpumalanga 100% attributed to Exxaro2 |
 |
Measured | 639 | 20.6 | 29.6 | 4.6 | 20.6 | 1.0 | 694 | 20.5 | 29.9 | 4.5 | 22.2 | 1.0 | (8) |
|---|---|---|---|---|---|---|---|---|---|---|---|---|---|---|---|
| Indicated | 114 | 20.7 | 28.7 | 4.5 | 20.7 | 0.8 | 123 | 20.4 | 29.4 | 4.5 | 22.1 | 0.8 | (7) | ||
| Inferred | 93 | 21.0 | 28.1 | 4.4 | 21.0 | 0.8 | 151 | 19.4 | 31.8 | 4.6 | 20.7 | 0.9 | (38) | ||
| Total | 847 | 20.7 | 29.3 | 4.5 | 20.7 | 1.0 | 969 | 20.3 | 30.2 | 4.5 | 21.9 | 0.9 | (13) | ||
| Resources inside LoMP | 281 | 21.3 | 27.7 | 4.8 | 23.1 | 1.0 | 290 | 21.3 | 27.7 | 4.8 | 22.9 | 1.0 | (3) | ||
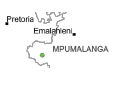
| Leeuwpan mine7 (OC) (commercial market) Mpumalanga 100% attributed to Exxaro2 |
 |
Measured | 77.9 | 20.0 | 31.3 | 3.2 | 18.6 | 1.2 | 79.9 | 20.1 | 31.3 | 3.2 | 18.7 | 1.2 | (2) |
| Indicated | 2.6 | 21.9 | 26.9 | 3.3 | 21.2 | 1.3 | (100) | ||||||||
| Inferred | 3.6 | 20.1 | 34.6 | 2.6 | 14.7 | 1.0 | 3.6 | 20.1 | 34.6 | 2.6 | 14.7 | 1.0 | – | ||
| Total | 81.5 | 20.0 | 31.5 | 3.2 | 18.4 | 1.2 | 86.1 | 20.1 | 31.3 | 3.2 | 18.6 | 1.2 | (5) | ||
| Resources inside LoMP | 49.1 | 20.0 | 30.6 | 3.1 | 19.5 | 1.3 | 52.6 | 20.1 | 30.7 | 3.1 | 19.6 | 1.3 | (7) | ||
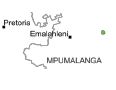
| Mafube mine (OC) (commercial market) Mpumalanga 50% attributed to Exxaro2 |
 |
Measured | 104.3 | 21.4 | 26.8 | 3.9 | 22.1 | 1.0 | 111.2 | 21.6 | 26.2 | 3.8 | 22.5 | 1.0 | (6) |
| Indicated | 9.9 | 21.7 | 26.0 | 3.9 | 22.4 | 1.0 | 9.9 | 21.7 | 26.0 | 3.9 | 22.4 | 1.0 | – | ||
| Inferred | 2.6 | 21.7 | 25.9 | 3.9 | 22.1 | 0.9 | 2.6 | 21.7 | 25.9 | 3.8 | 22.1 | 0.9 | – | ||
| Total | 116.8 | 21.5 | 26.7 | 3.9 | 22.1 | 1.0 | 123.7 | 21.6 | 26.1 | 3.8 | 22.5 | 1.0 | (6) | ||
| Resources inside LoMP | 53.4 | 22.0 | 25.6 | 4.0 | 22.0 | 1.1 | 59.2 | 22.2 | 24.5 | 3.8 | 22.9 | 1.0 | (10) | ||
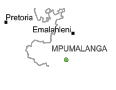
| Belfast mine (OC/UG) (mining right) Mpumalanga 100% attributed to Exxaro2 |
 |
Measured | 68.3 | 24.8 | 18.6 | 3.6 | 23.2 | 1.1 | 71.3 | 24.8 | 18.5 | 3.6 | 23.3 | 1.1 | (4) |
| Indicated | 19.9 | 22.3 | 25.3 | 3.6 | 22.0 | 1.1 | 19.9 | 22.3 | 25.3 | 3.6 | 22.0 | 1.1 | – | ||
| Inferred | 33.8 | 21.5 | 27.0 | 3.4 | 20.9 | 0.8 | 34.0 | 21.5 | 26.9 | 3.4 | 20.9 | 0.8 | (1) | ||
| Total | 121.9 | 23.5 | 22.0 | 3.5 | 22.4 | 1.0 | 125.3 | 23.5 | 21.9 | 3.5 | 22.4 | 1.0 | (3) | ||
| Resources inside LoMP | 41.1 | 25.0 | 18.5 | 3.5 | 23.5 | 1.2 | 44.2 | 25.0 | 18.4 | 3.5 | 23.5 | 1.2 | (7) | ||
| Grootegeluk mine (OC) (commercial market) Limpopo 100% attributed to Exxaro2 |
Volksrust Formation | Measured | 1 833 | 14.1 | 54.8 | 1.7 | 19.6 | 1.2 | 1 876 | 14.1 | 54.8 | 1.7 | 19.6 | 1.2 | (2) |
| Indicated | 1 118 | 14.1 | 55.0 | 1.7 | 19.6 | 1.2 | 1 119 | 14.1 | 55.0 | 1.7 | 19.6 | 1.2 | – | ||
| Inferred | 262 | 14.3 | 54.0 | 1.8 | 19.8 | 1.4 | 262 | 14.3 | 54.0 | 1.8 | 19.8 | 1.4 | – | ||
| Total | 3 213 | 14.1 | 54.8 | 1.7 | 19.6 | 1.2 | 3 256 | 14.1 | 54.8 | 1.7 | 19.6 | 1.2 | (1) | ||
| Resources inside LoMP | 2 312 | 14.2 | 54.6 | 1.7 | 19.8 | 1.2 | 2 355 | 14.2 | 54.6 | 1.7 | 19.8 | 1.2 | (2) | ||
| Grootegeluk mine (OC) (commercial market) Limpopo 100% attributed to Exxaro2 |
Vryheid Formation | Measured | 648 | 24.0 | 27.4 | 1.8 | 22.2 | 2.2 | 657 | 24.0 | 27.4 | 1.8 | 22.2 | 2.2 | (1) |
| Indicated | 303 | 23.7 | 28.4 | 1.7 | 22.1 | 2.3 | 303 | 23.7 | 28.4 | 1.7 | 22.1 | 2.3 | – | ||
| Inferred | 76 | 23.6 | 28.9 | 1.7 | 21.5 | 2.2 | 76 | 23.6 | 28.9 | 1.7 | 21.5 | 2.2 | – | ||
| Total | 1 027 | 23.9 | 27.8 | 1.8 | 22.1 | 2.2 | 1 036 | 23.9 | 27.8 | 1.8 | 22.1 | 2.2 | (1) | ||
| Resources inside LoMP | 601 | 23.8 | 27.9 | 1.8 | 22.3 | 2.3 | 607 | 23.9 | 28.0 | 1.8 | 22.4 | 2.3 | (1) | ||
| Total Grootegeluk mine (OC) (commercial market) Limpopo 100% attributed to Exxaro2 |
 |
Measured | 2 481 | 16.7 | 47.7 | 1.8 | 20.3 | 1.5 | 2 532 | 16.7 | 47.7 | 1.8 | 20.3 | 1.5 | (2) |
| Indicated | 1 421 | 16.1 | 49.3 | 1.7 | 20.1 | 1.4 | 1 422 | 16.1 | 49.3 | 1.7 | 20.1 | 1.4 | – | ||
| Inferred | 338 | 16.4 | 48.4 | 1.8 | 20.2 | 1.6 | 338 | 16.4 | 48.4 | 1.8 | 20.2 | 1.6 | – | ||
| Total | 4 240 | 16.5 | 48.3 | 1.8 | 20.2 | 1.5 | 4 291 | 16.5 | 48.3 | 1.8 | 20.2 | 1.5 | (1) | ||
| Resources inside Grootegeluk opencast LoMP | 2 913 | 16.2 | 49.1 | 1.7 | 20.3 | 1.4 | 2 965 | 16.2 | 49.1 | 1.7 | 20.3 | 1.4 | (2) | ||
| Thabametsi project (OC/UG) (mining right) Limpopo 100% attributed to Exxaro2 |
 |
Measured | 270 | 13.0 | 52.3 | 1.9 | 20.0 | 1.2 | 270 | 13.0 | 52.3 | 1.9 | 20.0 | 1.2 | – |
| Indicated | 749 | 12.6 | 53.1 | 1.8 | 19.8 | 1.1 | 749 | 12.6 | 53.1 | 1.8 | 19.8 | 1.1 | – | ||
| Inferred | 2 857 | 12.7 | 52.7 | 1.9 | 19.3 | 1.3 | 2 857 | 12.7 | 52.7 | 1.9 | 19.3 | 1.3 | – | ||
| Total | 3 876 | 12.7 | 52.7 | 1.9 | 19.5 | 1.3 | 3 876 | 12.7 | 52.7 | 1.9 | 19.7 | 1.3 | – | ||
| Resources inside IPP LoMP | 133 | 12.0 | 54.7 | 1.9 | 20.0 | 1.0 | 133 | 12.0 | 54.7 | 1.9 | 20.0 | 1.0 | – | ||
| Moranbah South project8 (UG) (prospecting) Australia 50% attributed to Exxaro2 |
 |
Measured | 484.6 | 26.9 | 23.6 | 2.6 | 18.5 | 0.6 | 482.0 | 26.7 | 23.7 | 2.6 | 18.5 | 0.6 | 1 |
| Indicated | 226.0 | 27.4 | 21.4 | 2.6 | 17.8 | 0.5 | 222.0 | 27.3 | 21.7 | 2.6 | 17.9 | 0.6 | 2 | ||
| Inferred | 29.7 | 28.2 | 19.6 | 2.7 | 16.9 | 0.5 | 28.0 | 28.5 | 18.9 | 2.7 | 17.0 | 0.5 | 6 | ||
| Total | 740.4 | 27.1 | 22.8 | 2.6 | 18.2 | 0.6 | 732.0 | 27.0 | 22.9 | 2.6 | 18.3 | 0.6 | 1 | ||
| 1 | Operation refers to operating mine or significant project. The mining methods are opencast (OC) and underground (UG). |
| 2 | Figures are reported at 100% irrespective of percentage attributable to Exxaro and refer to 2021 only. |
| 3 | Locality maps are for illustrative purposes only. Detailed maps are provided in the ancillary section. |
| 4 | Raw coal qualities (air-dried basis). CV: calorific value (gross), ash content (ash), IM: inherent moisture, S: total sulphur and VM: volatile matter. |
| 5 | The percentage difference between 2021 reported MTIS and 2020 reported MTIS with brackets signifying a negative. |
| 6 | The change is predominantly the result of the removal of remnant coal blocks not meeting RPEEE criteria. |
| 7 | The movement between categories is the result of infill drilling in the OI west area, upgrading the Indicated to Measured Resources. |
| 8 | Estimates are received from Anglo American Metallurgical Coal Proprietary Limited and not audited by Exxaro. |
The table below details the total Coal Reserves estimated as at 31 December 2021.
Table 10: Coal Reserves
| 2021 | 2020 | |||||||||||||
| RoM and saleable tonnes5 | RoM and saleable tonnes5 | |||||||||||||
| Operation1 | Location3 | LoM (years)4 |
Category | RoM (Mt) |
RoM moisture % |
Export (Mt) |
Thermal (Mt) |
Metal- lurgical (Mt) |
RoM (Mt) |
RoM moisture % |
Export (Mt) |
Thermal (Mt) |
Metal- lurgical (Mt) |
% change in RoM6 |
| Matla7 (UG) (captive market) 100% attributed to Exxaro2 |
 |
3+ | Proved | 124 | 9.1 | 138 | 148 | 7.7 | 148 | (16) | ||||
|---|---|---|---|---|---|---|---|---|---|---|---|---|---|---|
| Probable | 38 | 8.9 | 23 | 22 | 9.7 | 22 | 74 | |||||||
| Total | 162 | 9.1 | 162 | 169 | 8.0 | 169 | (4) | |||||||
| Inferred Resources inside LoMP | 8 | 8 | (10) | |||||||||||
| Leeuwpan8 (OC) (commercial market) 100% attributed to Exxaro2 |
 |
8 | Proved | 40.2 | 3.1 | 27.3 | 42.0 | 3.1 | 27.8 | (4) | ||||
| Probable | 3.2 | 2.6 | 1.9 | 5.7 | 2.8 | 2.0 | 1.9 | (44) | ||||||
| Total | 43.5 | 3.1 | 27.3 | 1.9 | 47.8 | 3.1 | 29.8 | 1.9 | (9) | |||||
| Inferred Resources inside LoMP | ||||||||||||||
| Mafube9 (OC) (commercial market) 50% attributed to Exxaro2 |
 |
10 | Proved | 26.7 | 5.7 | 18.0 | 32.1 | 5.7 | 21.1 | (17) | ||||
| Probable | 23.0 | 5.8 | 14.8 | 23.0 | 5.8 | 14.8 | – | |||||||
| Total | 49.7 | 5.7 | 32.8 | 55.1 | 5.7 | 35.9 | (10) | |||||||
| Inferred Resources inside LoMP | 1.7 | 1.7 | – | |||||||||||
| Belfast10 (OC) (commercial market) 100% attributed to Exxaro2 |
 |
12 | Proved | 37.5 | 3.4 | 33.3 | 40.2 | 3.3 | 36.5 | (7) | ||||
| Probable | 2.4 | 2.6 | 1.8 | 2.1 | 2.9 | 1.7 | 14 | |||||||
| Total | 39.9 | 3.3 | 35.1 | 42.3 | 3.3 | 38.2 | (6) | |||||||
| Inferred Resources inside LoMP | 0.5 | 0.5 | - | |||||||||||
| Waterberg Complex | ||||||||||||||
| Grootegeluk mine (OC) (commercial market) 100% attributed to Exxaro2 |
 |
20+ | Proved | 1 682 | 3.0 | 109 | 689 | 39 | 1 730 | 3.0 | 113 | 712 | 40 | (3) |
| Probable | 898 | 3.0 | 58 | 368 | 21 | 898 | 3.0 | 59 | 370 | 21 | – | |||
| Total | 2 580 | 3.0 | 168 | 1 057 | 59 | 2 628 | 3.0 | 171 | 1 082 | 61 | (2) | |||
| Inferred Resources inside LoMP | 137 | 137 | - | |||||||||||
| Thabametsi project11 (OC) (IPP market) 100% attributed to Exxaro2 |
|
25 | Proved | |||||||||||
| Probable | 130 | 3.0 | 127 | 130 | 3.0 | 127 | – | |||||||
| Total | 130 | 3.0 | 127 | 130 | 3.0 | 127 | – | |||||||
| Inferred Resources inside LoMP | ||||||||||||||
| 1 | Operation refers to operating mine or significant project. Mining method: opencast (OC) or underground (UG). |
| 2 | Figures are reported at 100% irrespective of percentage attributable to Exxaro and refer to 2021 only. |
| 3 | Locality maps are for illustrative purposes only. Detailed maps are provided in the ancillary section. |
| 4 | The + symbol is used in instances where the scheduled LoMP extends beyond the expiry of the mining right. In each instance, Exxaro has a reasonable expectation that the mining right will be renewed. |
| 5 | Export refers to export thermal coal except at Grootegeluk mine where it refers to semi-soft coking coal suitable for the export and inland markets. |
| 6 | The percentage difference between 2021 reported RoM and 2020 reported RoM, and the percentage difference between 2021 reported total saleable tonnes and 2020 reported total saleable tonnes. Brackets signify a negative. |
| 7 | Movement between categories is primarily the result of stooping areas downgraded to Probable Reserves (~15Mt) without surface ownership. |
| 8 | Movement from Probable to Proved reflects the change in the Resource. The increase in the LoM year is due to the adjustment in annual RoM volumes. |
| 9 | Decrease is primarily the result of mining depletion (5.2Mt). |
| 10 | Increase in Probable is the result of a new mine layout. The increase in the LoM year is due to the adjustment in annual RoM volumes. |
| 11 | The Coal Reserve is reported as Probable as a result of the lapse of the IPP project development agreement. |
Table 11: Coal Reserve qualities
| THERMAL saleable (Proved + Probable) |
METALLURGICAL saleable (Proved + Probable) |
COKING saleable (Proved + Probable) |
|||||||||||||||||
| Operation | Seam/layer | Tonnes (Mt)1 |
CV MJ/ kg |
% VM |
% Ash |
% S |
Yield % |
Tonnes (Mt)1 |
CV MJ/ kg |
% VM |
% Ash |
% S |
Yield % |
Tonnes (Mt)1 |
CV MJ/ kg |
% VM |
% Ash |
% S |
Yield % |
| Matla mine | Seam 2 | 62 | 22.6 | 24.8 | 22.7 | 0.8 | 100.0 | ||||||||||||
| Seam 4 | 100 | 19.5 | 23.5 | 29.3 | 1.0 | 100.0 | |||||||||||||
| Leeuwpan mine | TC2 | 10.7 | 22.3 | 19.2 | 27.3 | 1.0 | 62.8 | ||||||||||||
| BC2 | 16.6 | 24.0 | 24.1 | 21.5 | 0.9 | 66.8 | 1.9 | 27.8 | 8.4 | 15.0 | 0.9 | 57.7 | |||||||
| Mafube mine | Middlings | 12.7 | 21.7 | 19.9 | 25.8 | 0.4 | 24.3 | ||||||||||||
| Export | 20.2 | 26.6 | 26.1 | 13.3 | 0.4 | 39.7 | |||||||||||||
| Belfast mine | Export | 35.1 | 25.4 | 23.2 | 17.1 | 0.6 | 88.1 | ||||||||||||
| Grootegeluk mine | All seams | 1 057 | 21.2 | 24.4 | 32.7 | 1.5 | 40.7 | 59 | 28.9 | 23.8 | 13.6 | 0.6 | 61.3 | 168 | 29.0 | 35.1 | 11.9 | 1.1 | 12.9 |
| Thabametsi Project3 | T1 | 64 | 12.7 | 20.0 | 53.9 | 1.1 | 98.0 | ||||||||||||
| T2 | 63 | 11.3 | 19.0 | 55.7 | 1.0 | 98.0 | |||||||||||||
| 1 | Saleable product tonnages are quoted in metric tonnes and million tonnes is abbreviated as Mt. |
| 2 | Top coal (TC) and bottom coal (BC). |
| 3 | Based on Thabametsi bench configuration as defined in phase 1 of the feasibility study. |
The table below details Base Metal Resources (exclusive) as at 31 March 2021.
Table 12: Base Metals Resources (exclusive) reported
| 2021 | 2020 | |||||||||||
| Tonnes and grade | Tonnes and grade | |||||||||||
| Operation1 | Category | Tonnes (Mt) |
% Zn |
% Pb |
% Cu |
Ag g/t |
Tonnes (Mt) |
% Zn |
% Pb |
% Cu |
Ag g/t |
% Change in RoM |
| Deeps mine3 Northern Cape(UG) (zinc, lead, copper and silver) 26% attributed to Exxaro2 |
Measured | 4.4 | 2.9 | 3.2 | 0.3 | 34.0 | 3.3 | 3.2 | 3.6 | 0.3 | 38.5 | 35 |
|---|---|---|---|---|---|---|---|---|---|---|---|---|
| Indicated | 5.9 | 3.0 | 2.2 | 0.5 | 31.0 | 3.9 | 3.2 | 2.7 | 0.5 | 37.1 | 51 | |
| Inferred | ||||||||||||
| Total | 10.3 | 3.0 | 2.6 | 0.4 | 32.0 | 7.2 | 3.2 | 3.1 | 0.5 | 37.7 | 44 | |
| Swartberg mine4 Northern Cape (OC/UG) (zinc, lead, copper and silver) 26% attributed to Exxaro2 |
Measured | |||||||||||
| Indicated | 72.6 | 0.9 | 2.4 | 0.3 | 43.0 | 63.7 | 0.9 | 2.6 | 0.3 | 45.4 | 14 | |
| Inferred | 19.0 | 1.4 | 2.6 | 0.2 | 46.0 | 19.1 | 1.1 | 2.8 | 0.2 | 45.4 | (1) | |
| Total | 91.6 | 1.0 | 2.4 | 0.3 | 43.0 | 82.8 | 1.0 | 2.7 | 0.3 | 45.4 | 11 | |
| Big Syncline project5 Northern Cape (OC) (zinc) 26% attributed to Exxaro2 |
Measured | |||||||||||
| Indicated | 6.1 | 3.0 | 1.1 | 16.0 | 6.1 | 3.0 | 1.1 | 15.5 | 0 | |||
| Inferred | 185.6 | 2.4 | 1.0 | 12.0 | 161.8 | 2.5 | 1.0 | 12.3 | 15 | |||
| Total | 191.7 | 2.5 | 1.0 | 12.0 | 167.9 | 2.5 | 1.0 | 12.4 | 14 | |||
| Gamsberg North mine6 Northern Cape (OC/UG) (zinc) 26% attributed to Exxaro2 |
Measured | 1.5 | 6.7 | 0.5 | 1.7 | 6.6 | 0.5 | (11) | ||||
| Indicated | 34.8 | 6.0 | 0.5 | 38.5 | 5.9 | 0.5 | (10) | |||||
| Inferred | 5.0 | 8.3 | 0.5 | 17.9 | 5.8 | 0.5 | (72) | |||||
| Total | 41.3 | 6.3 | 0.5 | 58.1 | 5.9 | 0.5 | (29) | |||||
| Gamsberg East7 Northern Cape (project) (zinc) 26% attributed to Exxaro2 |
Measured | |||||||||||
| Indicated | ||||||||||||
| Inferred | 49.8 | 8.5 | 0.5 | 48.5 | 8.5 | 0.5 | 3 | |||||
| Total | 49.8 | 8.5 | 0.5 | 48.5 | 8.5 | 0.5 | 3 | |||||
| Gamsberg South8 Northern Cape (project) (zinc) 26% attributed to Exxaro2 |
Measured | |||||||||||
| Indicated | ||||||||||||
| Inferred | 23.2 | 7.1 | 0.6 | |||||||||
| Total | 23.2 | 7.1 | 0.6 | |||||||||
| 1 | Operation refers to the BMM operating mine or significant project. Mining method: opencast (OC) or underground (UG). |
| 2 | Figures are reported at 100% irrespective of percentage attributable to Exxaro. |
| 3 | The increase is mainly the result of changes to wireframes and commodity prices. |
| 4 | The increase is mainly the result of additional exploration and upgrade of Inferred material to Indicated. |
| 5 | Big Syncline is a brownfields exploration project. This is a high-volume, low-grade Zn deposit. The increase is the result of changes to Resource reporting criteria with increased commodity prices. |
| 6 | The decrease is the result of Resources being transferred to Reserves. |
| 7 | The increase is mainly the result of changes to reporting criteria with increased commodity prices. |
| 8 | Gamsberg South lies to the south of the Gamsberg open pit and was declared for the first time in 2021. |
Table 13: Base Metals Reserves reported
| 2021 | 2020 | ||||||||||||
| Grade and contained metals | Grade and contained metals | % Change in RoM |
|||||||||||
| Operation1 | LoM (years) |
Category | RoM (Mt)3 |
% Zn |
% Pb |
% Cu |
Ag g/t |
RoM (Mt)3 |
% Zn |
% Pb |
% Cu |
Ag g/t |
|
| BMM Deeps mine3Northern Cape (UG) (zinc, lead, copper and silver) 26% attributed to Exxaro2 |
3 | Proved | 1.3 | 2.7 | 3.5 | 0.3 | 35.0 | 1.5 | 2.9 | 3.4 | 0.3 | 35.2 | (11) |
|---|---|---|---|---|---|---|---|---|---|---|---|---|---|
| Probable | 2.9 | 2.9 | 1.4 | 0.7 | 20.0 | 2.5 | 3.1 | 1.6 | 0.7 | 21.1 | 18 | ||
| Total | 4.2 | 2.8 | 2 | 0.5 | 24.0 | 3.9 | 3.0 | 2.3 | 0.5 | 26.4 | 7 | ||
| Inferred Resources inside LoMP | – | ||||||||||||
| BMM Swartberg mine4 Northern Cape (OC/UG) (zinc, lead, copper and silver) 26% attributed to Exxaro2 |
3 | Proved | |||||||||||
| Probable | 24.4 | 0.5 | 1.8 | 0.5 | 22.0 | 25.4 | 0.5 | 1.7 | 0.5 | 21.6 | (4) | ||
| Total | 24.4 | 0.5 | 1.8 | 0.5 | 22.0 | 25.4 | 0.5 | 1.7 | 0.5 | 21.6 | (4) | ||
| Inferred Resources inside LoMP | – | ||||||||||||
| Gamsberg North mine5 Northern Cape (OC) (zinc) 26% attributed to Exxaro2 |
12 | Proved | 79.4 | 6.5 | 0.5 | 78.2 | 6.4 | 0.5 | 2 | ||||
| Probable | 30.9 | 5.2 | 0.5 | 29.9 | 5.2 | 0.5 | 3 | ||||||
| Total | 110.4 | 6.1 | 0.5 | 108.1 | 6.1 | 0.5 | 2 | ||||||
| Inferred Resources inside LoMP | |||||||||||||
| 1 | Operation refers to the BMM operating mine or significant project. Mining method: opencast (OC) or underground (UG). |
| 2 | Figures are reported at 100% irrespective of percentage attributable to Exxaro and refer to March 2021 only. |
| 3 | The net increase is the result of both Resource transferred to Reserve and mining depletion. |
| 4 | The decrease is due to mining depletion. |
| 5 | The increase is due to transferral of exclusive Resources into Reserves. |
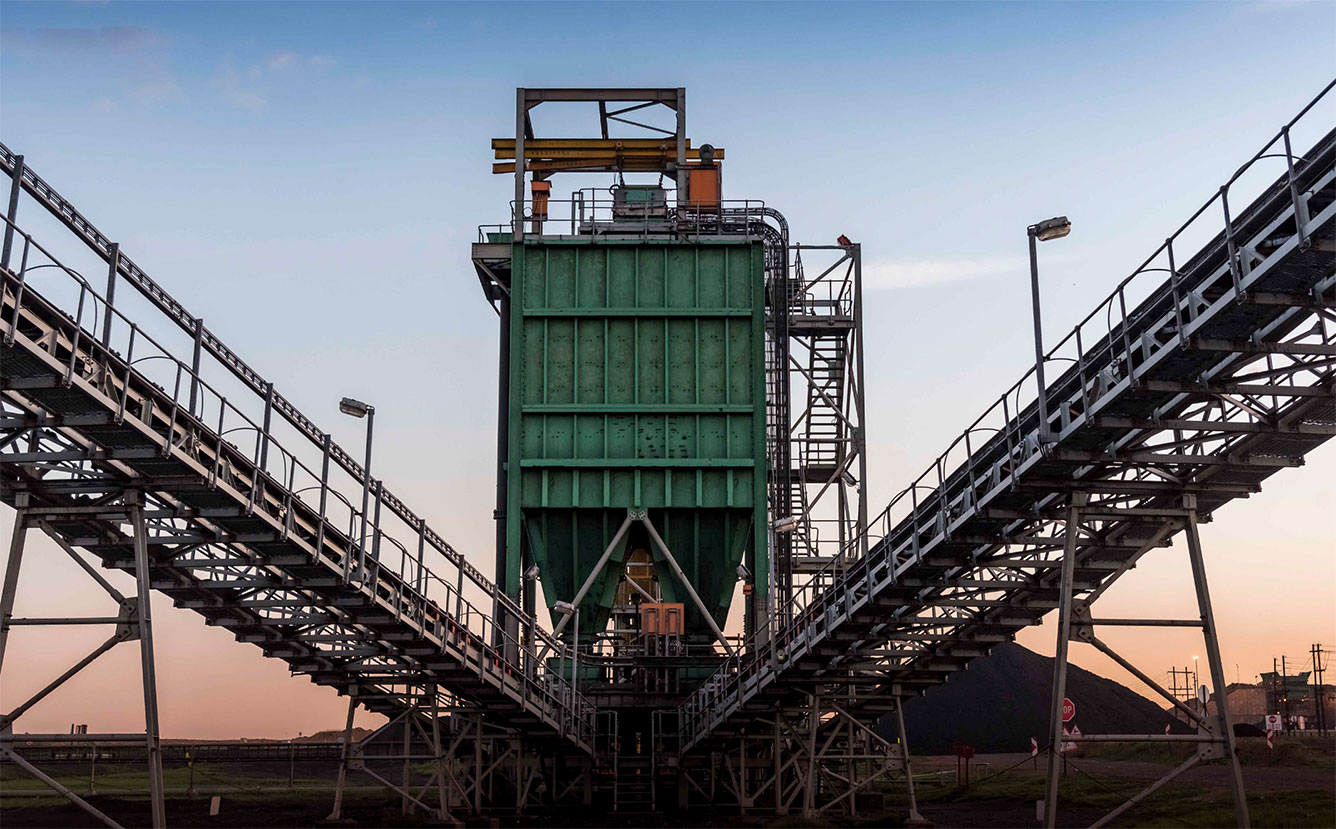
Silo at ECC