Integrated report 2019

Exxaro Resources Limited
Consolidated Mineral Resources and Mineral Reserves Report
The Mineral Resources and Mineral Reserves remaining as at 31 December 2019 are indicated in this document. Mineral Resource and Mineral Reserve figures are not an inventory of all mineral occurrences drilled or sampled but a realistic record of those which, under assumed and justifiable technical and economic conditions, may be economically extractable currently and in future.
Mineral Resources and Mineral Reserves are reported inclusive of Mineral Resources that have been converted to Mineral Reserves. An exception is reporting for Gamsberg and Black Mountain Mining because figures received from Vedanta (JORC Code) represent Mineral Resources excluding those Mineral Resources converted to Mineral Reserves.
Exxaro includes all estimates directly under its management control and estimates of entities in which Exxaro holds a 25% interest or larger. Mineral Resources and Mineral Reserves are reported at 100% irrespective of the percentage attributable to Exxaro.
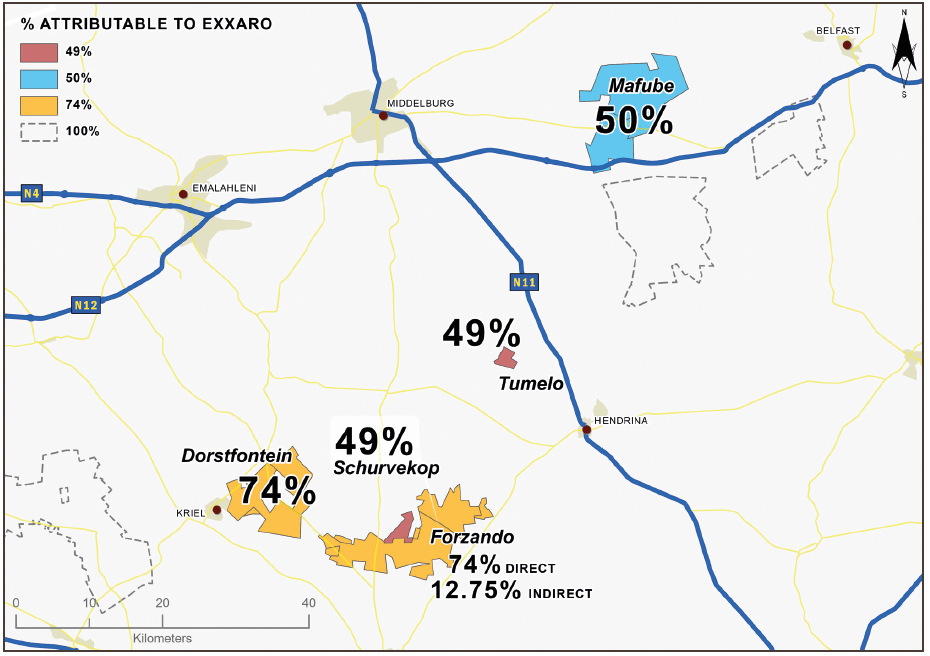
The percentage attributable tonnage (only coal) can be deduced from the attributable ownership (Figure 8) stated in the Coal Resources and Coal Reserves tables and the summarised tonnages are shown in Table 4.
Explanations for material changes in year-on-year movements are provided as footnotes in the Mineral Resources and Mineral Reserves tables.
Table 4: Attributable Coal Resource and Coal Reserve tonnages
|
Figure 8: Coal joint venture operations in Mpumalanga
The table below details the total inclusive Coal Resources estimated as at 31 December 2019.
Table 5: Coal Resources and qualities
| 2019 | 2018 | ||||||||||||||
|---|---|---|---|---|---|---|---|---|---|---|---|---|---|---|---|
| Tonnes and quality4 | Tonnes and quality4 | ||||||||||||||
| Operation1 | Location3 | Resource category |
Tonnes (Mt) |
CV MJ/kg |
% Ash |
% IM |
% VM |
% S |
Tonnes (Mt) |
CV MJ/kg |
% Ash |
% IM |
% S |
change in tonnes5 |
|
| Arnot mine6 |  |
Measured | 20.2 | 24.2 | 26.6 | 4.0 | 26.6 | 1.0 | 20.2 | 24.2 | 26.6 | 4.0 | 1.0 | ||
| (OC) (in closure) | Indicated | 18.9 | 24.5 | 26.7 | 3.8 | 26.7 | 0.9 | 18.9 | 24.5 | 26.7 | 3.8 | 0.9 | |||
| Mpumalanga | Inferred | 8.8 | 24.0 | 26.7 | 3.9 | 26.7 | 0.8 | 8.8 | 24.0 | 26.7 | 3.9 | 0.8 | |||
| 100% attributable to Exxaro2 | Total | 47.9 | 24.3 | 26.7 | 3.9 | 26.7 | 1.0 | 47.9 | 24.3 | 26.7 | 3.9 | 1.0 | |||
| Resources inside LoM plan | |||||||||||||||
| Arnot mine6 | 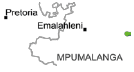 |
Measured | 118.3 | 23.6 | 22.0 | 4.0 | 23.6 | 1.0 | 118.3 | 23.6 | 22.0 | 4.0 | 1.0 | ||
| (UG) (in closure) | Indicated | 45.4 | 23.4 | 22.6 | 4.2 | 22.5 | 0.9 | 45.4 | 23.4 | 22.6 | 4.2 | 0.9 | |||
| Mpumalanga | Inferred | 12.5 | 23.8 | 21.4 | 4.3 | 22.0 | 0.9 | 12.5 | 23.8 | 21.4 | 4.3 | 0.9 | |||
| 100% attributable to Exxaro2 | Total | 176.2 | 23.5 | 22.1 | 4.1 | 23.2 | 1.0 | 176.2 | 23.5 | 22.1 | 4.1 | 1.0 | |||
| Resources inside LoM plan | |||||||||||||||
| Matla mine | 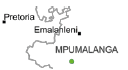 |
Measured | 705 | 20.2 | 30.6 | 4.5 | 22.0 | 1.0 | 713 | 20.2 | 30.6 | 4.5 | 1.0 | (1) | |
| (UG) (captive market) | Indicated | 105 | 21.1 | 27.6 | 4.3 | 22.1 | 0.9 | 97 | 20.8 | 28.1 | 4.4 | 0.9 | 8 | ||
| Mpumalanga | Inferred | 232 | 19.6 | 30.8 | 4.5 | 21.3 | 0.9 | 240 | 19.6 | 30.9 | 4.5 | 0.9 | (3) | ||
| 100% attributable to Exxaro2 | Total | 1 043 | 20.1 | 30.4 | 4.5 | 21.8 | 1.0 | 1 050 | 20.1 | 30.4 | 4.5 | 1.0 | (1) | ||
| Resources inside LoM plan | 311 | 21.2 | 27.6 | 4.7 | 22.9 | 1.0 | 327 | 21.1 | 27.7 | 4.7 | 1.0 | (5) | |||
| Leeuwpan mine | 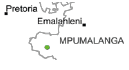 |
Measured | 92.8 | 20.1 | 31.3 | 3.0 | 18.1 | 1.1 | 101.1 | 20.1 | 31.3 | 3.2 | 1.1 | (8) | |
| (OC) (commercial market) |
Indicated | 2.6 | 20.7 | 29.1 | 2.8 | 21.1 | 1.2 | 2.6 | 20.7 | 29.1 | 2.8 | 1.2 | |||
| Mpumalanga | Inferred | 3.6 | 21.0 | 32.3 | 2.3 | 14.0 | 1.1 | 3.6 | 21.0 | 32.3 | 2.3 | 1.1 | |||
| 100% attributable to Exxaro2 | Total | 99.0 | 20.2 | 31.3 | 2.9 | 18.0 | 1.1 | 107.3 | 20.1 | 31.3 | 3.2 | 1.1 | |||
| Resources inside LoM plan | 64.6 | 20.0 | 31.1 | 2.7 | 18.9 | 1.2 | 71.7 | 20.0 | 31.1 | 3.1 | 1.2 | ||||
| Mafube mine7 | 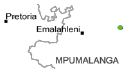 |
Measured | 117.6 | 21.5 | 26.9 | 3.8 | 22.4 | 1.0 | 124.5 | 21.5 | 26.9 | 3.8 | 1.0 | (6) | |
| (OC) (commercial market) |
Indicated | 9.7 | 21.9 | 25.9 | 3.9 | 22.6 | 0.9 | 10.1 | 22.0 | 25.7 | 3.9 | 0.9 | (4) | ||
| Mpumalanga | Inferred | ||||||||||||||
| 50% attributable to Exxaro2 | Total | 127.3 | 21.5 | 26.8 | 3.8 | 22.4 | 1.0 | 134.7 | 21.6 | 26.8 | 3.8 | 1.0 | (5) | ||
| Resources inside LoM plan | 56.5 | 21.9 | 25.6 | 3.7 | 22.7 | 1.0 | 61.7 | 21.9 | 25.6 | 3.7 | 1.0 | (8) | |||
| Belfast mine | 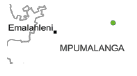 |
Measured | 74.6 | 24.9 | 18.5 | 3.6 | 23.3 | 1.1 | 81.1 | 24.8 | 18.7 | 3.6 | 1.1 | (8) | |
| (OC) (mining right) | Indicated | 20.1 | 22.4 | 25.2 | 3.6 | 22.0 | 1.1 | 22.4 | 21.6 | 26.9 | 3.7 | 1.1 | (10) | ||
| Mpumalanga | Inferred | 34.1 | 21.6 | 26.8 | 3.4 | 20.9 | 0.8 | 34.4 | 20.0 | 31.2 | 3.4 | 1.0 | (1) | ||
| 100% attributable to Exxaro2 | Total | 128.8 | 23.6 | 21.7 | 3.5 | 22.5 | 1.0 | 137.8 | 23.1 | 23.2 | 3.6 | 1.1 | (7) | ||
| Resources inside LoM plan | 45.7 | 25.0 | 18.3 | 3.5 | 23.6 | 1.2 | 47.1 | 25.2 | 17.6 | 3.6 | 1.2 | (3) | |||
| Dorstfontein complex8 | 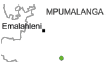 |
Measured | 149.1 | 19.8 | 33.6 | 2.9 | 20.0 | 1.1 | 156.4 | 19.9 | 33.3 | 2.9 | 1.1 | (5) | |
| (OC/UG) (commercial market) |
Indicated | 135.5 | 19.3 | 34.4 | 3.1 | 19.8 | 1.2 | 137.5 | 19.3 | 34.2 | 3.2 | 1.2 | (1) | ||
| Mpumalanga | Inferred | 52.1 | 19.3 | 34.4 | 2.9 | 19.3 | 1.1 | 52.8 | 19.3 | 34.6 | 2.9 | 1.1 | (1) | ||
| 74% attributable to Exxaro2 | Total | 336.7 | 19.5 | 34.0 | 3.0 | 19.8 | 1.1 | 346.7 | 19.6 | 33.9 | 3.0 | 1.1 | (3) | ||
| Resources inside LoM plan | 102.2 | 20.0 | 32.5 | 3.0 | 20.2 | 1.1 | 117.9 | 19.9 | 32.7 | 3.0 | 1.1 | (13) | |||
| Forzando complex9 | |
Measured | 85.5 | 21.6 | 29.1 | 2.8 | 23.3 | 1.1 | 81.5 | 21.6 | 29.1 | 2.8 | 1.1 | 5 | |
| (OC/UG) (commercial market) |
Indicated | 36.3 | 22.2 | 27.6 | 2.8 | 22.7 | 1.3 | 35.9 | 22.3 | 27.5 | 2.8 | 1.2 | 1 | ||
| Mpumalanga | Inferred | 26.4 | 21.2 | 30.2 | 2.9 | 20.6 | 1.2 | 25.8 | 21.3 | 30.1 | 2.9 | 1.2 | 2 | ||
| 86.74% attributable to Exxaro2 | Total | 148.2 | 21.7 | 28.9 | 2.9 | 22.6 | 1.2 | 143.2 | 21.8 | 28.9 | 2.8 | 1.2 | 3 | ||
| Resources inside LoM plan | 43.3 | 21.2 | 30.1 | 2.8 | 22.9 | 1.1 | 70.3 | 21.2 | 30.0 | 2.8 | 1.1 | (38) | |||
| Forzando projects | |
Measured | 0.2 | 21.3 | 30.7 | 2.5 | 19.6 | 0.5 | 0.2 | 21.4 | 30.6 | 2.5 | 0.5 | 8 | |
| (prospecting right) | Indicated | 2.1 | 21.6 | 29.5 | 2.7 | 18.0 | 0.7 | 1.6 | 21.6 | 29.3 | 2.7 | 0.7 | 26 | ||
| Mpumalanga | Inferred | 0.5 | 18.0 | 38.5 | 3.1 | 16.6 | 0.6 | 0.4 | 17.7 | 39.3 | 3.1 | 0.6 | 16 | ||
| 86.74% attributable to Exxaro2 | Total | 2.8 | 20.9 | 31.1 | 2.8 | 17.9 | 0.6 | 2.3 | 20.8 | 31.2 | 2.8 | 0.6 | 22 | ||
| Schurvekop 1063 PR10 | 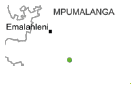 |
Measured | 35.5 | 20.1 | 31.9 | 3.3 | 22.0 | 1.2 | 35.0 | 20.2 | 31.7 | 3.3 | 1.2 | 1 | |
| (prospecting right) Mpumalanga | Indicated | 6.5 | 20.1 | 31.9 | 3.3 | 21.0 | 1.2 | 5.6 | 20.1 | 31.7 | 3.3 | 1.1 | 16 | ||
| 49% attributable to Exxaro2 | Inferred | 0.2 | 19.6 | 32.6 | 3.8 | 21.7 | 0.8 | 0.2 | 19.7 | 32.3 | 3.8 | 0.8 | |||
| Total | 42.2 | 20.0 | 32.2 | 3.3 | 21.9 | 1.2 | 40.8 | 20.1 | 31.7 | 3.3 | 1.2 | 3 | |||
| Tumelo mine10 | 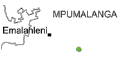 |
Measured | 8.4 | 21.6 | 29.9 | 2.5 | 21.6 | 1.5 | 8.7 | 21.7 | 29.7 | 2.5 | 1.5 | (3) | |
| (UG) Mpumalanga | Indicated | 0.2 | 20.6 | 32.8 | 2.5 | 21.1 | 1.6 | 0.2 | 20.6 | 32.8 | 2.5 | 1.6 | |||
| 49% attributable to Exxaro2 | Inferred | 1.8 | 21.4 | 31.0 | 2.4 | 19.4 | 1.8 | 1.8 | 21.4 | 31.0 | 2.4 | 1.8 | |||
| Total | 10.4 | 21.5 | 30.1 | 2.5 | 21.2 | 1.6 | 10.7 | 21.6 | 29.9 | 2.5 | 1.6 | (3) | |||
| Grootegeluk mine |  |
Measured | 2 786 | 16.7 | 47.8 | 1.7 | 20.3 | 1.5 | 2 844 | 16.7 | 47.8 | 1.7 | 1.5 | (2) | |
| (OC) (commercial market) |
Indicated | 1 017 | 16.5 | 48.4 | 1.6 | 20.0 | 1.4 | 1 017 | 16.5 | 48.4 | 1.6 | 1.4 | |||
| Limpopo | Inferred | 653 | 16.5 | 48.0 | 1.8 | 20.1 | 1.5 | 653 | 16.5 | 48.0 | 1.8 | 1.5 | |||
| 100% attributable to Exxaro2 | Total | 4 455 | 16.7 | 48.0 | 1.7 | 20.2 | 1.5 | 4 514 | 18.2 | 48.0 | 1.7 | 1.5 | (1) | ||
| Resources inside Grootegeluk opencast LoM plan | 3 722 | 16.3 | 48.8 | 1.7 | 20.2 | 1.5 | 3 780 | 16.3 | 48.8 | 1.7 | 1.5 | (2) | |||
| Thabametsi project11 |  |
Measured | 270 | 13.0 | 52.3 | 1.9 | 20.0 | 1.2 | 270 | 13.0 | 52.3 | 1.9 | 1.2 | ||
| (OC/UG) (mining right) |
Indicated | 749 | 12.6 | 53.1 | 1.8 | 19.8 | 1.1 | 749 | 12.6 | 53.1 | 1.8 | 1.1 | |||
| Limpopo | Inferred | 2 916 | 12.7 | 52.7 | 1.9 | 19.3 | 1.3 | 2 916 | 12.7 | 52.7 | 1.9 | 1.3 | |||
| 100% attributable to Exxaro2 | Total | 3 935 | 12.7 | 52.7 | 1.9 | 19.7 | 1.3 | 3 935 | 12.7 | 52.7 | 1.9 | 1.3 | |||
| Resources inside LoM plan | 133 | 12.0 | 54.7 | 1.9 | 20.0 | 1.0 | 133 | 12.0 | 54.7 | 1.9 | 1.0 | ||||
| Waterberg North project12 |  |
Measured | Relinquished | ||||||||||||
| (prospecting) | Indicated | ||||||||||||||
| Limpopo | Inferred | 2 147 | 13.3 | 49.7 | 2.5 | 1.2 | |||||||||
| 100% attributable to Exxaro2 | Total | 2 147 | 13.3 | 49.7 | 2.5 | 1.2 | |||||||||
| Moranbah South project13 |  |
Measured | Relinquished | ||||||||||||
| (UG) (prospecting) Australia | Indicated | ||||||||||||||
| 50% attributable to Exxaro2 | Inferred | 869 | 15.9 | 39.6 | 2.9 | 1.7 | |||||||||
| Total | 869 | 15.9 | 39.6 | 2.9 | 1.7 | ||||||||||
| Moranbah South project13 |  |
Measured | 482 | 26.7 | 23.7 | 2.6 | 18.5 | 0.6 | 482 | 26.7 | 23.7 | 2.6 | 0.6 | ||
| (UG) (prospecting) Australia | Indicated | 222 | 27.3 | 21.7 | 2.6 | 17.9 | 0.6 | 222 | 27.3 | 21.7 | 2.6 | 0.6 | |||
| 50% attributable to Exxaro2 | Inferred | 28 | 28.5 | 18.9 | 2.7 | 17.0 | 0.5 | 28 | 28.5 | 18.9 | 2.7 | 0.5 | |||
| Total | 732 | 27.0 | 22.9 | 2.6 | 18.3 | 0.6 | 732 | 27.0 | 22.9 | 2.6 | 0.6 | ||||
Rounding of figures may cause computational discrepancies
The table below details the total Coal Reserves estimated as at 31 December 2019.
Table 6: Coal Reserves reported
| 2019 | 2018 | |||||||||||||||
|---|---|---|---|---|---|---|---|---|---|---|---|---|---|---|---|---|
| RoM and saleable tonnes5 | RoM and saleable tonnes5 | |||||||||||||||
| Operation1 | Location3 | Life of mine (years)4 |
Category | RoM (Mt) |
RoM moisture % |
Export (Mt |
Thermal (Mt) |
Metal-lurgical (Mt) |
RoM (Mt) | RoM moisture % |
Export (Mt) |
Thermal (Mt) |
Metal-lurgical (Mt) |
% change in RoM6 |
||
| Matla mine7 | 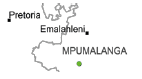 |
4+ | Proved | 145.3 | 7.7 | 145.3 | 171.6 | 7.8 | 171.6 | (15) | ||||||
| (UG) (captive market) |
Probable | 15.6 | 9.7 | 15.6 | 16.3 | 6.3 | 16.3 | (4) | ||||||||
| 100% attributable to Exxaro2 | Total | 160.9 | 7.9 | 160.9 | 187.9 | 7.6 | 187.9 | (14) | ||||||||
| Inferred Resources inside LoM plan | 27.2 | 25.6 | 6 | |||||||||||||
| Leeuwpan mine8 | 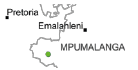 |
11 | Proved | 45.9 | 3.1 | 33.2 | 53.7 | 3.2 | 38.8 | (14) | ||||||
| (OC) (commercial market) |
Probable | 6.1 | 2.7 | 3.2 | 1.3 | 2.7 | 2.3 | 0.4 | (1) | |||||||
| 100% attributable to Exxaro2 | Total | 52.1 | 3.1 | 36.4 | 1.3 | 3.1 | 41.0 | 0.4 | (13) | |||||||
| Inferred Resources inside LoM plan | ||||||||||||||||
| Mafube mine9 | 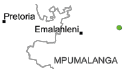 |
11 | Proved | |||||||||||||
| (OC) (commercial market) |
Probable | 56.7 | 8.4 | 36.9 | 62.0 | 8.3 | 26.5 | 13.9 | (9) | |||||||
| 50% attributable to Exxaro2 | Total | 56.7 | 8.4 | 36.9 | 62.0 | 8.3 | 26.5 | 13.9 | (9) | |||||||
| Inferred Resources inside LoM plan | ||||||||||||||||
| Belfast mine | 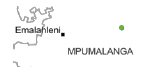 |
12 | Proved | 42.2 | 3.3 | 30.8 | 6.9 | 45.7 | 35.3 | 8.1 | (8) | |||||
| (OC) (commercial market) |
Probable | 1.4 | 3.0 | 0.7 | 0.6 | 100 | ||||||||||
| 100% attributable to Exxaro2 | Total | 43.6 | 3.3 | 31.6 | 7.5 | 45.7 | 35.1 | 8.1 | (5) | |||||||
| Inferred Resources inside LoM plan | 0.7 | 0.5 | 40 | |||||||||||||
| Dorstfontein complex10 | 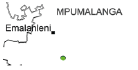 |
17+ | Proved | 46.5 | 3.3 | 14.3 | 14.0 | 54.3 | 2.7 | 29.4 | (14) | |||||
| (OC/UG) (commercial market) |
Probable | 41.5 | 3.3 | 13.3 | 13.3 | 40.5 | 3.1 | 24.6 | 2 | |||||||
| 74% attributable to Exxaro2 | Total | 88.0 | 3.3 | 27.6 | 27.4 | 94.8 | 2.9 | 54.0 | (7) | |||||||
| Inferred Resources inside LoM plan | 0.9 | 3.3 | 0.3 | 0.2 | 5.7 | 2.8 | 2.8 | (84) | ||||||||
| Forzando complex11 | 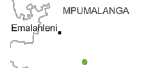 |
8+ | Proved | 23.9 | 2.7 | 13.8 | 38.6 | 2.2 | 19.9 | (38) | ||||||
| (OC/UG) (commercial market) |
Probable | 10.7 | 2.9 | 6.4 | 15.9 | 2.8 | 9.3 | (33) | ||||||||
| 86.74% attributable to Exxaro2 | Total | 34.6 | 2.8 | 20.2 | 54.5 | 2.4 | 29.2 | (37) | ||||||||
| Inferred Resources inside LoM plan | 0.1 | 2.9 | 7.5 | 2.5 | 4.0 | (99) | ||||||||||
| Waterberg Complex |  |
|||||||||||||||
| Grootegeluk mine | 20+ | Proved | 2 520 | 3.0 | 146 | 1 015 | 70 | 2 576 | 3.0 | 149 | 1 039 | 72 | (2) | |||
| (OC) (commercial market) |
Probable | 645 | 3.0 | 60 | 398 | 26 | 645 | 3.0 | 60 | 398 | 26 | |||||
| 100% attributable to Exxaro2 | Total | 3 165 | 3.0 | 206 | 1 413 | 96 | 3 221 | 3.0 | 209 | 1 437 | 98 | (2) | ||||
| Inferred Resources inside LoM plan | 510 | 510 | ||||||||||||||
| Thabametsi project |  |
26+ | Proved | 109.0 | 3.0 | 107.0 | 109.0 | 107.0 | ||||||||
| (OC) (IPP market) | Probable | 21.0 | 3.0 | 20.0 | 21.0 | 20.0 | ||||||||||
| 100% attributable to Exxaro2 | Total | 130.0 | 3.0 | 127.0 | 130.0 | 127.0 | ||||||||||
| Inferred Resources inside LoM plan | ||||||||||||||||
Rounding of figures may cause computational discrepancies.
Table 7: Coal Reserve qualities in 2019
| THERMAL saleable (Proved and Probable) |
METALLURGICAL saleable (Proved and Probable) |
COKING saleable (Proved and Probable) |
|||||||||||||||||||
| Seam/ layer |
Tonnes (Mt)1 |
CV MJ/ kg |
% VM |
% Ash |
% S |
Yield % |
Tonnes (Mt) |
CV MJ/ kg |
% VM |
% Ash |
% S |
Yield % |
Tonnes (Mt)1 |
CV MJ/ kg |
% VM |
% Ash |
% S |
Yield % |
|||
| Matla mine | 2 seam | 52.0 | 26.0 | 23.6 | 26.2 | 0.8 | 100 | ||||||||||||||
| 4 seam | 109.0 | 19.3 | 21.3 | 30.5 | 0.9 | 100 | |||||||||||||||
| Leeuwpan mine | TC2 | 15.2 | 22.6 | 19.2 | 26.9 | 0.8 | 65 | ||||||||||||||
| BC2 | 21.2 | 23.6 | 23.4 | 22.8 | 1.0 | 79 | 1.3 | 28.0 | 8.4 | 15.1 | 0.9 | 63 | |||||||||
| Mafube mine | Middlings | 12.6 | 22.0 | 21.6 | 25.0 | 0.6 | 22 | ||||||||||||||
| Export | 24.3 | 26.5 | 26.2 | 13.6 | 0.4 | 43 | |||||||||||||||
| Belfast mine | Thermal | 7.5 | 23.1 | 21.7 | 24.5 | 1.2 | 100 | ||||||||||||||
| Export | 31.6 | 26.1 | 23.9 | 15.3 | 0.6 | 87 | |||||||||||||||
| Dorstfontein complex | All seams | 55.0 | 24.2 | 21.9 | 21.3 | 0.6 | 62 | ||||||||||||||
| Forzando complex | All seams | 20.2 | 24.7 | 26.6 | 20.4 | 1.1 | 58 | ||||||||||||||
| Grootegeluk mine | All seams | 1 413 | 21.0 | 23.8 | 33.1 | 1.5 | 41 | 95.9 | 28.9 | 23.9 | 13.7 | 0.6 | 56 | 206.3 | 29.1 | 35.1 | 11.7 | 1.2 | 13 | ||
| Thabametsi3 | T1 | 64.0 | 12.7 | 20.0 | 53.9 | 1.1 | 98 | ||||||||||||||
| project | T2 | 63.0 | 11.3 | 19.0 | 55.7 | 1.0 | 98 | ||||||||||||||
Rounding of figures may cause computational discrepancies.
The table below details Base Metal Resources (exclusive) as at 31 March 2019.
Table 8: Base Metal Resources (exclusive) reported
| 2019 | 2018 | ||||||||||||
|---|---|---|---|---|---|---|---|---|---|---|---|---|---|
| Tonnes and grade | Tonnes and grade | ||||||||||||
| Operation1 | Category | Tonnes (Mt) |
% Zn |
% Pb |
% Cu |
Ag g/t |
Tonnes (Mt) |
% Zn |
% Pb |
% Cu |
Ag g/t |
% change in tonnes |
|
| BMM Deeps mine3 | Measured | 5.6 | 2.9 | 3.2 | 0.3 | 37.0 | 4.0 | 3.1 | 3.4 | 0.3 | 38.1 | 41 | |
| Northern Cape (UG) (zinc, lead, copper and silver) | Indicated | 9.1 | 2.6 | 2.2 | 0.5 | 27.0 | 6.6 | 2.8 | 2.7 | 0.5 | 32.7 | 37 | |
| 26% attributable to Exxaro2 | Inferred | ||||||||||||
| Total | 14.6 | 2.7 | 2.6 | 0.4 | 31.0 | 10.6 | 2.9 | 3.0 | 0.4 | 34.7 | 38 | ||
| BMM Swartberg mine3 | Measured | ||||||||||||
| Northern Cape (UG) (zinc, lead, copper and silver) | Indicated | 57.3 | 1.3 | 3.2 | 0.3 | 53.0 | 35.7 | 0.8 | 3.7 | 0.3 | 57.0 | 61 | |
| 26% attributable to Exxaro2 | Inferred | 14 | 1.2 | 3.4 | 0.3 | 48.0 | 26.5 | 2.2 | 3.0 | 0.2 | 50.2 | (47) | |
| Total | 71.3 | 1.3 | 3.2 | 0.3 | 52.0 | 62.2 | 1.4 | 3.4 | 0.3 | 54.1 | 15 | ||
| BMM Big Syncline project4 | Measured | ||||||||||||
| Northern Cape (OC) (zinc) | Indicated | ||||||||||||
| 26% attributable to Exxaro2 | Inferred | 151.7 | 2.5 | 1.0 | 13.0 | 100 | |||||||
| Total | 151.7 | 2.5 | 1.0 | 13.0 | 100 | ||||||||
| Gamsberg North mine5 | Measured | 35.1 | 6.5 | 0.6 | 43.3 | 6.6 | 0.6 | (19) | |||||
| Northern Cape (OC) (zinc) | Indicated | 35.8 | 6.6 | 0.6 | 54.6 | 5.9 | 0.5 | (34) | |||||
| 26% attributable to Exxaro2 | Inferred | 17.9 | 6.7 | 0.5 | 32.1 | 5.8 | 0.5 | (44) | |||||
| Total | 88.8 | 6.6 | 0.6 | 130 | 6.1 | 0.5 | (32) | ||||||
| Gamsberg East6 | Measured | ||||||||||||
| Northern Cape | Indicated | ||||||||||||
| (project) (zinc) 26% attributable to Exxaro2 |
Inferred | 42.2 | 9.0 | 0.6 | 32.3 | 9.8 | 0.6 | 31 | |||||
| Total | 42.2 | 9.0 | 0.6 | 32.3 | 9.8 | 0.6 | 31 | ||||||
Rounding of figures may cause computational discrepancies.
The table below details Base Metal Reserves as at 31 March 2019.
Table 9: Base Metal Reserves reported
| 2019 | 2018 | |||||||||||||
|---|---|---|---|---|---|---|---|---|---|---|---|---|---|---|
| Tonnes and grade | Tonnes and grade | |||||||||||||
| Operation1 | Life of mine (years) | Category | RoM (Mt)3 |
% Zn |
% Pb |
% Cu |
Ag g/t |
RoM (Mt)3 |
% Zn |
% Pb |
% Cu |
Ag g/t | % change in RoM |
|
| BMM Deeps mine | 4 | Proved | 1.6 | 2.9 | 3.6 | 0.3 | 37.0 | 1.3 | 3.0 | 4.0 | 0.3 | 43.3 | ||
| Northern Cape (UG) (zinc, lead, copper and silver) |
Probable | 3.5 | 2.9 | 1.4 | 0.7 | 21.0 | 4.3 | 3.0 | 1.7 | 0.7 | 23.8 | |||
| 26% attributable to Exxaro2 | Total | 5.1 | 2.9 | 2.1 | 0.6 | 26.0 | 5.6 | 3.0 | 2.2 | 0.6 | 28.2 | (9) | ||
| Inferred Resources inside LoM plan | ||||||||||||||
| BMM Swartberg mine3 | 4 | Proved | ||||||||||||
| Northern Cape (UG) (zinc, lead, copper and silver) |
Probable | 2.6 | 0.7 | 3.4 | 0.5 | 28.0 | 2.3 | 0.6 | 3.3 | 0.5 | 30.8 | |||
| 26% attributable to Exxaro2 | Total | 2.6 | 0.7 | 3.4 | 0.5 | 28.0 | 2.3 | 0.6 | 3.3 | 0.5 | 30.8 | 12 | ||
| Inferred Resources inside LoM plan | ||||||||||||||
| Gamsberg North mine | 13 | Proved | 50.3 | 6.8 | 0.5 | 44.5 | 6.8 | 0.5 | ||||||
| Northern Cape (OC) (zinc) |
Probable | 3.4 | 5.8 | 0.5 | 8.7 | 6.0 | 0.5 | |||||||
| 26% attributable to Exxaro2 | Total | 53.7 | 6.7 | 0.5 | 53.2 | 6.6 | 0.5 | 1 | ||||||
| Inferred Resources inside LoM plan | 0.4 | |||||||||||||
Rounding of figures may cause computational discrepancies.