


Managing and enhancing financial capital is pivotal to delivering sustainable growth and creating long-term value for stakeholders.
Our financial capital refers to the funding and resources we generate and manage that enable us to execute our strategy. It underpins our ability to drive sustainable growth and achieve our purpose of powering better lives in Africa and beyond.
Financial capital enables us to support operations, foster innovation and invest in projects that support a low-carbon transition. By maintaining a balanced approach to capital allocation, we deliver returns for our shareholders while investing in initiatives that create long-term economic, environmental and social value.
| Material theme | Matters | Strategies to achieve our objectives | Related
strategic objective |
Our broader impact |
 Adapting to a changing context |
|
|
 |
|
 Executing our strategy |
|
|
||
 Driving business resilience |
|
|
||

As we enter 2025, we remain focused on navigating global uncertainties while strengthening our operational resilience.
Global coal demand will be shaped by geopolitical factors and energy security needs, while domestic demand may strengthen as Eskom addresses operational challenges. Infrastructure constraints persist, but we are actively exploring alternative routes to market. Iron ore prices remain under pressure due to rising supply, though early signs of recovery in Chinese demand offer a potential upside.
The LSP will expand our renewable energy capacity, reinforcing our commitment to a low-carbon future.
Amid shifting commodity markets and geopolitical pressures, we will prioritise cost efficiency, supply chain agility and strategic diversification to drive long-term growth and stakeholder value.
FD's overview
The tougher conditions we experienced in 2024 resulted in a 22% decrease in EBITDA to R10.4 billion. The contribution from our non-controlled operations showed a significant decrease of 47% in adjusted# equity-accounted income to R3.7 billion, primarily from SIOC, driven by lower iron ore prices and sales volumes. This translated into basic HEPS of R30.16 compared to R46.81 in 2023. We are pleased to have declared a final cash dividend to shareholders of R8.66 per share.
Given the net cash position at 31 December 2024 of R16.3 billion (excluding energy net debt), in addition to the final cash dividend declared, the board of directors has approved a R1.2 billion share repurchase programme.

|
Revenue of R40.7 billion up 5% |
EBITDA* of R10.4 billion, down 22% |
Adjusted#
equity-accounted R3.7 billion, down 47% |
|
Headline earnings of R30.16 per share, down 36% |
Cash generated
by R10.4 billion, down 22% |
Final cash
dividend R8.66 per share
|
| * | EBITDA is calculated by adjusting net operating profit before tax with depreciation, amortisation, impairment charges or impairment reversals and net losses or gains on disposal of assets and investments (including translation differences recycled to profit or loss). |
| # | Adjusted for headline earnings adjustments. |
Nearly half of the world's population went to the voting polls in 2024, leading to major shifts in global and country specific politics. We also saw that evolving geopolitical and economic tensions are leading to increased fragmentation in the global economy. Inflation and monetary policy saw significant developments as global disinflation continued which prompted a pivot in monetary policy with central banks easing interest rates to boost economic activity.
In South Africa, the peaceful completion of the 29 May 2024 general election and the formation of the Government of National Unity, led to improved local consumer and global investor sentiment, fostering cautious optimism for improved economic growth.
The coal market in 2024 started on a bearish note in the first quarter of 2024 following trends from late 2023. This was primarily due to sufficient coal supply in key markets such as India, Japan, South Korea and Taiwan, with lower gas prices making it a more competitive alternative in Europe.
However, geopolitical factors played a significant role in lifting prices higher, alongside the TFR derailments in 2024.
The resurgence in Indian demand was primarily maintained due to its strong economic growth, despite a brief decline between July 2024 and September 2024 due to high stockpiles of South African coal, the monsoon season, low domestic coal prices and low steel prices. European demand faced headwinds from strong renewable energy generation, revision of coal phase-out targets and cheaper gas prices.
Japanese and South Korean demand remained steady, with Japan continuing to benefit from a diverse energy mix (gas, renewables, nuclear and coal). Still, the restart of several nuclear plants posed a risk to coal demand.
The benchmark API4 RBCT export price averaged US$105 per tonne in 2024, compared to US$121 per tonne in 2023, a 13% decline.
The South African domestic market demand remained resilient in the second half of 2024 despite macro-economic impacts affecting domestic end users. In the Waterberg region, Eskom's coal offtake improved slightly, but operational challenges at the power stations continued to impact its ability to consistently take coal from Grootegeluk mine.
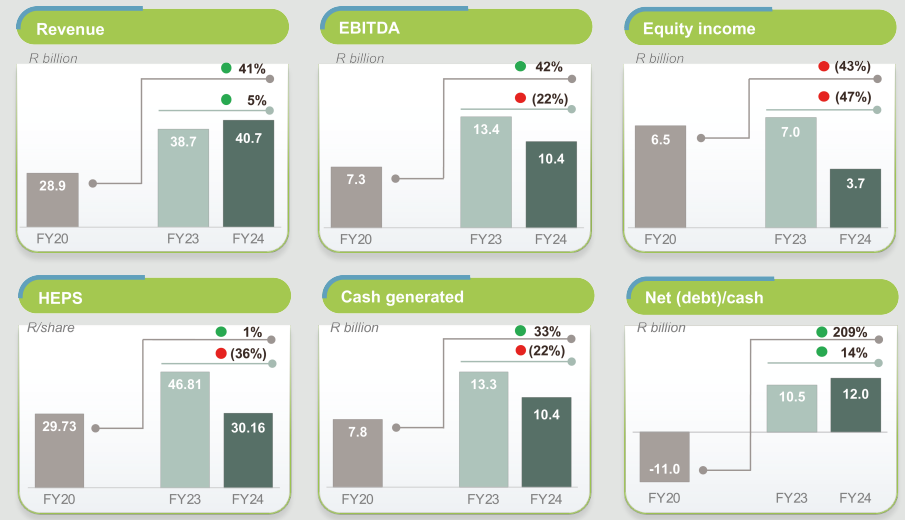
Group revenue increased by 5% to R40 725 million (2023: R38 698 million), primarily due to a 6% increase in coal revenue and 5% increase in energy revenue.
Group EBITDA declined by 22% to R10 423 million (2023: R13 399 million), mainly attributable to a 16% decrease in coal EBITDA and a negative contribution from the Other operating segment.
The graph below provides the main drivers for the decrease in group EBITDA
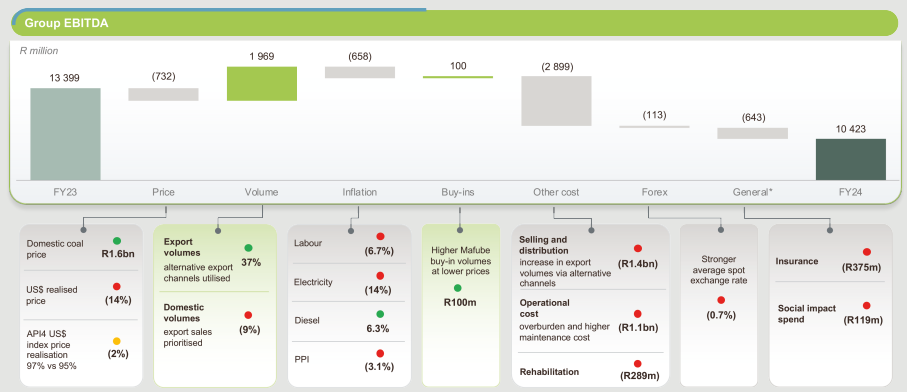
*Total EBITDA variance for Matla included = -R4 million.
The higher revenue from our commercial mines was mainly due to higher export volumes, albeit at a lower realised average export price of US$100 per tonne (2023: US$117 per tonne). Despite the decline, Exxaro achieved a strong 95% price realisation in 2024 compared to 97% in 2023 owing to our effective market to resource optimisation initiatives. Higher domestic sales prices were insufficient to offset the lower domestic volumes, as we moved additional volumes into the export market.
Our export volumes increased by 37% to 7Mt as we were able to use alternative distribution channels as well as improved TFR performance in the latter part of the year. Exxaro's export evacuation through RBCT increased by 13% to 5.2Mtpa (2023: 4.6Mtpa), despite continued disruptions. Additionally, export evacuation using alternate channels increased to 1.8Mtpa (2023: 479kt) using alternative routes and ports to fulfil market demand.
We also experienced inflationary pressure, with electricity costs rising by 14%, labour costs averaging a 6.7% increase, and the rest of our costs increasing in line with the Producer Price Index (PPI) at 3.1%. There was some relief, as our diesel cost decreased by 6.3%.
Our buy-in volumes from Mafube in our Mafube JV were higher compared to 2023 but at lower prices.
Beyond inflation, other cost factors also influenced EBITDA:
| Adjusted equity-accounted income/(loss) |
Dividends received | |||||||
| 2024 Rm |
2023 Rm |
Change % |
2024 Rm |
2023 Rm |
Change % |
|||
| Coal: Mafube | 243 | 510 | (52) | 130 | 1525 | (91) | ||
|---|---|---|---|---|---|---|---|---|
| Coal: RBCT | (6) | (8) | (25) | |||||
| Ferrous: SIOC | 3383 | 6157 | (45) | 3741 | 3386 | 10 | ||
| Other: Black Mountain | 65 | 332 | (80) | |||||
| Total | 3685 | 6991 | (47) | 3871 | 4911 | (21) | ||
Adjusted equity-accounted income from associates and JVs decreased by 47% to R3 685 million (2023: R6 991 million). The contribution from SIOC declined by 45%, mainly driven by lower iron ore prices and lower sales volumes. Mafube's contribution declined by 52% owing largely to lower coal export prices. The decline in contribution from Black Mountain was mainly impacted by production challenges resulting in lower production and sales volumes.
Headline earnings decreased by 36% to R7 298 million (2023: R11 327 million), mainly driven by the 22% decrease in group EBITDA and a 47% decrease in adjusted equity-accounted income, as discussed above.
The weighted average number of shares remained unchanged at 242 million, translating into HEPS of 3 016 cents per share (2023: 4 681 cents per share).
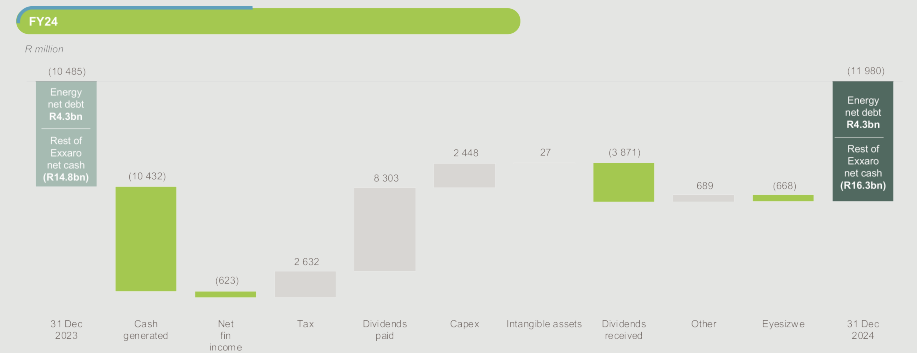
In terms of our capital allocation framework, free cash flow generated will be prioritised per the diagram below:
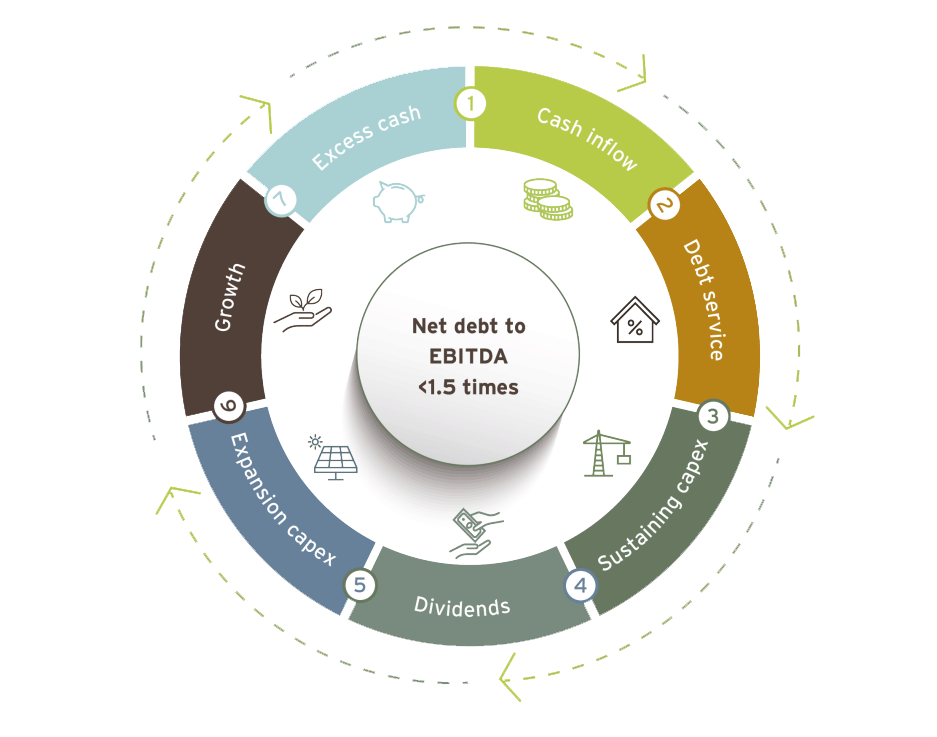
The diagram represents the order of our capital allocation framework. In applying it, we aim for a gearing ratio of below 1.5 times net debt (excluding ring-fenced project financing) to EBITDA. The framework aligns with our commitment to sustainably returning cash to shareholders through the cycle while retaining a strong financial position.
During 2024, we had cash inflows of R12.3 billion (2023: R16 billion), comprising R7.8 billion from our operations net of tax paid (2023: R10.7 billion), dividend income received from our equity-accounted investments of R3.9 billion (2023: R4.9 billion) as well as net interest received of R0.6 billion (2023: R0.4 billion).
In terms of our capital allocation framework, we then utilised this cash to mainly:
Exxaro remains in a strong liquidity position with a net cash balance of R12.0 billion as at 31 December 2024 (2023: R10.5 billion) and undrawn borrowing facilities and maturities as set out below. Excluding the energy net debt, the net cash position at 31 December 2024 was R16.3 billion (2023: R14.8 billion).
Refer below to our capital funding structure for Exxaro (excluding energy) as well as energy on a standalone basis:
| Facilities available | |||||
| Drawn Rm |
Undrawn/ committed Rm |
Uncommitted Rm |
|||
| Term loan and revolving facility | 2 950 | 3 250 | 2 0001 | ||
|---|---|---|---|---|---|
| Domestic medium-term note programme | 5 0002 | ||||
| Interest-bearing borrowings | 2 950 | ||||
| Interest capitalised | 52 | ||||
| Lease liabilities | 348 | Maturity profile of debt | |||
| Capitalised transaction costs | (5) | Rm | |||
| Total interest-bearing debt | 3 345 | Repayment period | 3 345 | ||
| Current | 586 | Less than 6 months | 319 | ||
| Non-current | 2 759 | 6 to 12 months | 267 | ||
| Net cash and cash equivalents | (19 654) | 1 to 2 years | 2 585 | ||
| Net cash | (16 309) | 2 to 3 years | 83 | ||
| 3 to 4 years | 73 | ||||
| 4 to 5 years | 18 | ||||
| 1 | Uncommitted Accordion facility |
| 2 | Uncommitted but available on market take up |
| Facilities available | ||||
| Drawn Rm |
Undrawn/ committed Rm |
|||
| Project financing | 5 233 | 587 | ||
|---|---|---|---|---|
| Interest-bearing borrowings | 5 233 | |||
| Interest capitalised | 2 | |||
| Lease liabilities | 82 | Maturity profile of debt | ||
| Capitalised transaction costs | (12) | Rm | ||
| Total interest-bearing debt | 5 305 | Repayment period | 5 305 | |
| Current | 386 | Less than 6 months | 197 | |
| Non-current | 4 919 | 6 to 12 months | 189 | |
| Net cash and cash equivalents | (976) | 1 to 2 years | 458 | |
| Net cash | 4 329 | 2 to 3 years | 568 | |
| 3 to 4 years | 693 | |||
| 4 to 5 years | 818 | |||
| More than 5 years | 2 382 | |||
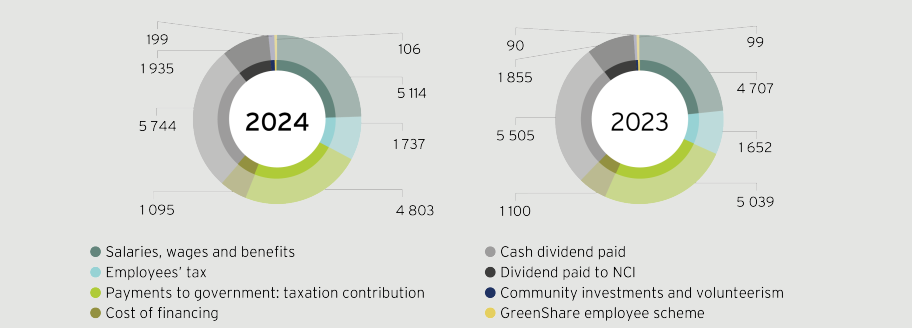
We distribute the value we generate to our stakeholders as follows:
All stakeholders benefit from continuous reinvestment into the group to ensure sustainability and expansion.

| 2024 Rm |
2023 Rm |
||
| Assets | |||
| Non-current assets | 66 799 | 66 153 | |
| Property, plant and equipment | 37 292 | 37 226 | |
| Intangible assets | 2 598 | 2 790 | |
| Right-of-use assets | 281 | 308 | |
| Equity-accounted investments | 20 596 | 20 278 | |
| Financial assets | 5 266 | 4 616 | |
| Deferred tax | 197 | 206 | |
| Other assets | 569 | 729 | |
| Current assets | 27 917 | 26 701 | |
| Inventories | 2 427 | 2 270 | |
| Financial assets | 159 | 210 | |
| Trade and other receivables | 4 230 | 3 877 | |
| Cash and cash equivalents | 20 630 | 19 859 | |
| Current tax receivables | 15 | 3 | |
| Other assets | 456 | 482 | |
| Total assets | 94 716 | 92 854 | |
| Equity and liabilities | |||
| Capital and other components of equity | |||
| Share capital | 983 | 983 | |
| Other components of equity | 1 119 | 1 341 | |
| Retained earnings | 51 885 | 49 923 | |
| Equity attributable to owners of the parent | 53 987 | 52 247 | |
| Non-controlling interests | 14 563 | 14 160 | |
| Total equity | 68 550 | 66 407 | |
| Non-current liabilities | 20 351 | 20 226 | |
| Interest-bearing borrowings | 7 344 | 7 480 | |
| Lease liabilities | 334 | 400 | |
| Other payables | 40 | 42 | |
| Provisions | 3 359 | 2 963 | |
| Retirement employee obligations | 181 | 176 | |
| Financial liabilities | 129 | 127 | |
| Deferred tax | 8 926 | 9 003 | |
| Other liabilities | 38 | 35 | |
| Current liabilities | 5 815 | 6 221 | |
| Interest-bearing borrowings | 876 | 1 443 | |
| Lease liabilities | 96 | 51 | |
| Trade and other payables | 3 351 | 3 356 | |
| Provisions | 282 | 222 | |
| Financial liabilities | 22 | 14 | |
| Current tax payables | 214 | 348 | |
| Other liabilities | 974 | 787 | |
| Total liabilities | |||
| Total equity and liabilities | 94 716 | 92 854 |
Property, plant, and equipment increased by R66 million compared to the corresponding period last year, including R2 146 million spent on sustaining capex (stay-in-business capex) and R302 million on expansion capex, offset by depreciation charges of R2 512 million. The net movement further included borrowing costs capitalised.
The graph below summarises key movements in the net cash balance for the year ended 31 December 2024.
| Target | 2024 | 2023 | ||
| Internal key performance indicators | ||||
| EBITDA interest cover*# (times) | >4 | |||
| Net debt/(cash): equity* (%) | <40 | (25) | (23) | |
| Net debt: EBITDA*## (times) | <1.5 | |||
| Return on total capital employed* (%) | >20 | 26 | 39 | |
| Return on total capital employed (%) | >20 | 23 | 35 | |
| Bank covenants** | ||||
| Net debt/(cash): equity (%) | <80 | (23) | (22) | |
| EBITDA interest cover# (times) | >4 | |||
| Net debt: EBITDA## (times) | <3 |
| * | Performance indicators exclude energy segment. |
| ** | Including dividends received from associates and contingent liabilities, except DMRE guarantees and excluding project financing entities. |
| # | Exxaro is in a net finance income position. |
| ## | Exxaro is in a net cash position. |
Despite the operational challenges experienced in 2024, all internal KPIs are well within target, indicating a healthy balance sheet and strong cash flow generation. The impact of various coal sensitivity measures and the key financial risk factors can be used to stress test our current headroom.
The group has complied with all the bank covenants for the year ended 31 December 2024.
For more details, refer to note 12.1.4 of the group and companyannual financial statements for the year ended 31 December 2024.
The following diagram indicates key sensitivities on the coal net operating profit.
| Sensitivity | Net operating profit impact Rm |
||
| Environmental rehabilitation discount rate decrease | 1% | (237) | |
|---|---|---|---|
| Environmental rehabilitation discount rate increase | 1% | 217 | |
| Royalty cost | 1% | 391 | |
| Domestic sales volumes | 1% | 278 | |
| Production cost | 1% | 174 | |
| Export price per tonne | US$1 | 128 | |
| Exchange rate | 10 cents | 59 | |
| Logistics | 1% | 46 | |
| Export sales volumes | 1% | 42 | |
| Labour | 1% | 37 | |
| Fuel | 1% | 17 | |
| Energy | 1% | 9 |
The group's strategic treasury function predominantly provides financial risk management services to the business, coordinates access to domestic and international financial markets, and monitors and manages the financial risks relating to the operations of the group through internal risk reports which analyse exposure by degree and magnitude of risks. These risks include market risk (including foreign currency risk, interest rate risk and price risk), credit risk and liquidity risk.
In managing its capital, the group focuses on a prudent gearing position, return on shareholders'equity (or return on capital employed) and the level of dividends to shareholders. The group's policy is to cover its annual net funding requirements through long-term loan facilities with maturities spread over time. Neither the company nor any of its subsidiaries are subject to externally imposed capital requirements.
Market risk is the risk that changes in market prices, such as foreign exchange rates, interest rates and equity prices, will affect profit or the value of its holdings of financial instruments. The objective of market risk management is to manage and control market risk exposure within acceptable parameters, while optimising the return on risk.
The group's activities expose it primarily to the financial risks of changes in the environmental rehabilitation funds, portfolio investment and deposit facilities quoted prices, foreign currency exchange rates and interest rates. The group enters into a variety of derivative financial instruments to manage its exposure to foreign currency risk and interest rate risks, including:
The group's exposure to equity price risk arises from investments held by and classified as at fair value through other comprehensive income or at fair value through profit or loss. The group's exposure to price risk in relation to quoted prices of the environmental rehabilitation funds, portfolio investments and deposit facilities is not considered a significant risk as the funds are invested with reputable financial institutions in accordance with a strict mandate to ensure capital preservation and growth. The funds are held for strategic purposes rather than trading purposes.
Certain transactions are denominated in foreign currencies, hence exposures to exchange rate fluctuations arise. The currency in which transactions are entered into is mainly denominated in US dollar, euro, and Australian dollar. Exchange rate exposures are managed within approved policy parameters utilising FECs, currency options and currency swap agreements.
The group maintains a fully covered exchange rate position in respect of foreign balances (if any) and imported capital equipment resulting in these exposures being fully converted to rand. Trade-related import exposures are managed through the use of economic hedges arising from export revenue as well as through FECs. Trade-related export exposures are hedged using FECs and currency options with specific focus on short-term receivables. Any open exposure to foreign currency risk on these balances is insignificant as the turnaround time is generally less than 30 days. Foreign denominated capital purchases funded by ZAR denominated project financing arrangements are hedged using FECs.
Monetary items have been translated at the closing rate at the last day of the reporting period.
The FECs which are used to hedge foreign currency exposure mostly have a maturity of less than one year from the reporting date. When necessary, FECs are rolled over at maturity.
For more details, refer to note 16.3.3.2.2 of the group and company annual financial statementsfor the year ended 31 December 2024.
The group is exposed to interest rate risk as it borrows and deposits funds at floating interest rates on the money market and extended bank borrowings. The group's main interest rate risk arises from long-term borrowings with floating rates, which expose the group to cash flow interest rate risk. The risk is managed by undertaking controlled management of the interest structures of the investments and borrowings, maintaining an appropriate mix between fixed and floating interest rate facilities in line with the interest rate expectations. The group also uses interest rate swaps and interest rate forwards to manage the interest rate risk exposure.
When the contractual terms of the borrowings and covenants thereof require the use of hedging instruments to mitigate the risk of fluctuations of the underlying interest rate risk cash flow exposure and the impact on profit or loss of specific projects being financed, the group looks to apply hedge accounting where an effective hedge relationship is expected and to the extent that such exposure poses a real risk to the achievement of the loan covenants.
The financial institutions chosen are subject to compliance with the relevant regulatory bodies.
For details on loan facility and bonds, refer to note note 16.3.3.2.2 of the group and company annual financial statementsfor the year ended 31 December 2024.
The group is exposed to the risk of variability in future interest payments on the project financing, attributable to fluctuations in the three-month Johannesburg Interbank Average Rate (JIBAR) during the operations phase and the one-month JIBAR during the construction phase. The designated hedged item is the group of expected floating interest rate cash flows arising from the project financing, up to the notional amount of each interest rate swap, over the term of the hedging relationship. The notional amounts per interest rate swap match up to the designated exposure being hedged.
Where all relevant criteria are met, hedge accounting is applied to remove the accounting mismatch between the hedging instrument and the hedged item. This will effectively result in recognising interest expense at a fixed interest rate for the hedged project financing.
For details on project financing, refer to note note 16.3.3.2.2 of the group and company annual financial statementsfor the year ended 31 December 2024.
Liquidity risk is the risk that the group will not be able to meet its financial obligations as they fall due. The group's approach to managing liquidity is to ensure, as far as possible, that it will always have sufficient liquidity to meet its liabilities when due, under normal and stressed conditions, without incurring unacceptable losses or risking damage to the group's reputation.
The ultimate responsibility for liquidity risk management rests with the board of directors, which has built an appropriate liquidity risk management framework for the management of the group's short, medium, and long-term funding and liquidity management requirements.
The group manages liquidity risk by monitoring forecast cash flows in compliance with loan covenants and ensuring that adequate unutilised borrowing facilities are maintained.
Borrowing capacity is determined by the board of directors, from time to time.
| 2024
Rm
Rm |
2023 Rm |
||
| Amount approved | 67 484 | 65 309 | |
|---|---|---|---|
| Total borrowings | (8 220) | (8 923) | |
| Unutilised borrowing capacity | 59 264 | 56 386 |
The group's capital base and the borrowing powers of the company and the group were set at 125% of shareholders'funds (equity attributable to owners of the parent) for both the 2024 and 2023 financial years.
To avoid incurring interest on late payments, financial risk management policies and procedures are entrenched to ensure the timeous matching of orders placed with goods received notes or services acceptances and invoices.
Credit risk relates to potential default by counterparties on cash and cash equivalents, loans, investments, trade receivables and other receivables.
The group limits its counterparty exposure arising from money market and derivative instruments by only dealing with well-established financial institutions of high credit standing. The group's exposure and the credit ratings of its counterparties are continuously monitored. The aggregate value of transactions concluded is spread among approved counterparties. Credit exposure is controlled by counterparty limits that are reviewed and approved by the audit committee annually.
Trade receivables consist of a number of customers with whom Exxaro has long standing relationships. A high portion of term supply arrangements exists with such customers resulting in limited credit exposure which exposure is limited by performing customer creditworthiness or country risk assessment.
The group strives to enter into sales contracts with customers which stipulate the required payment terms. It is expected of each customer that these payment terms are adhered to. Where trade receivable balances become past due, the normal recovery procedures are followed to recover the debt, where applicable new payment terms may be arranged to ensure that the debt is fully recovered.
Exxaro has concentration risk as a result of its exposure to one major customer. This is, however, not considered significant as the customer adheres to the stipulated payment terms.
Exxaro establishes an allowance for non-recoverability or impairment that represent its estimate of expected credit losses in respect of trade receivables, other receivables, loans, cash and cash equivalents and investments.
For Exxaro's exposure to credit risk, refer to note note 16.3.3.4.1 of the group and company annual financial statementsfor the year ended 31 December 2024.
As we move into 2025, the global economic landscape remains uncertain, with geopolitical tensions and policy shifts continuing to evolve. While these international developments will undoubtedly have an impact on our business, our focus remains firmly on the factors within our control.
The formation of the Government of National Unity has improved sentiment, fostering a sense of cautious optimism for economic growth. We are seeing positive developments, such as increased private investment in renewables, Eskom's progress on maintenance and transmission upgrades, and accelerated reforms in ports and rails.
Furthermore, the new two-pot retirement system was expected to ease household debt and boost consumer spend from late 2024 into 2025. In 2024, South Africa's real GDP grew 0.6%, driven by a strong fourth quarter after downward pressures faced in earlier quarters. We are hopeful that the momentum will continue into 2025.
The seaborne thermal coal demand is expected to be influenced by geopolitical factors and energy security needs. Domestically, any improvement in the local economic environment is likely to boost coal demand from local end users, particularly as Eskom works to address its operational challenges. Infrastructure challenges remain, as evidenced by the recent railway breakdown on the RBCT Waterberg line due to heavy rainfall. We will continue to actively explore all available routes to market to meet customer demand and unlock value.
This continuous rise in iron ore supply and exports remains the key limiting factor for seaborne iron ore prices, affecting the performance of Exxaro's SIOC investment. While major miners'supply is increasing, overall Chinese demand remains relatively flat. However, towards the end of 2024, there was a rise in steel and iron ore demand from non-property sectors. Early signs indicate that the Chinese government's interventions are beginning to yield results, evidenced by the manufacturing and services sectors moving into expansionary territory, assisted by improved steel mill margins.
Our business is still impacted by commodity prices, domestic structural challenges and developments, coal offtake, and the global and domestic geopolitical environment. We provide the following guidance for the 2025 financial year:
Riaan Koppeschaar
FD
15 April 2025