Exxaro Resources limited
Environmental, social and governance report 2021
The efficient use of energy is critical, particularly in South Africa, where electricity costs are increasing and primarily generated using fossil fuels. Exxaro is committed to being carbon neutral by 2050 for scope 1 and 2, and we recognise that energy management is the key driver of carbon emissions and therefore the achievement of decarbonisation goals.
We uphold our licence to operate through:
How we manage our energy consumption will play a vital role in whether we achieve our goal of being carbon neutral by 2050.
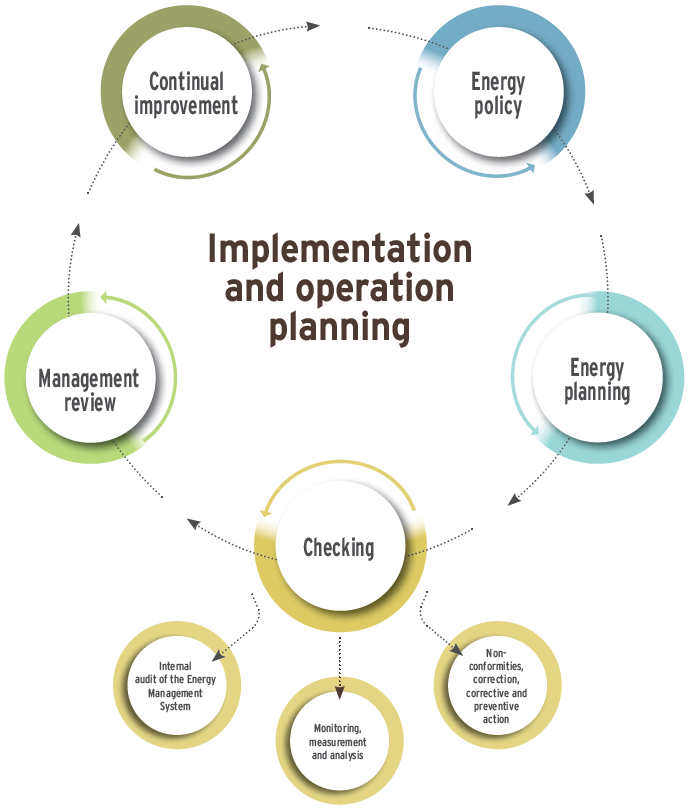
Innovative and efficient energy management is critical on our path to carbon neutrality. As we prepare our business for the low-carbon economy, we must ensure that decarbonisation thinking is embedded in our operations with an ongoing commitment to reduce scope 1 and 2 emissions across BUs and our value chain. To support these goals, a group-wide energy and carbon management programme was implemented during the year.
| 1 | The 12L tax rebate provides a rebate for businesses that implement energy efficiency projects and savings. |
Our journey aims to be inclusive, sustainable and productive. As such, we consider our whole value chain and support our suppliers on our decarbonisation journey.
BU managers at each operation are responsible for the management and achievement of energy management objectives. They are supported by the group engineering manager and the executive head: projects and technology.
Our energy and carbon management programme aims to reduce energy consumption and increase efficient diesel and electricity consumption. Our technology and engineering department's projects aim to reduce diesel consumption at our operations with fuel additives and payload management.
While we have always strived to reduce our energy consumption, our large-scale investments previously centred on Grootegeluk, our largest coal mining operation, due to the scale of opportunities and the impact of these initiatives on energy intensity. Our focus at Grootegeluk has set the base for our processes and strategy. In 2021, we shifted our focus to include all active operations to implement a cohesive energy management system to baseline energy intensity, set targets, and measure performance of the identified initiatives to reduce energy and carbon intensity in 2022 and beyond.
Employee energy-saving behaviour impacts our results. With our human resources, business improvement and information management departments, we are driving behaviour change through embedding a culture of energy awareness, reduction and accountability by all employees. This involves ongoing communication, awareness training and engagement. Operational teams are taking ownership of and supporting efforts to establish the energy management systems, with engineering teams championing initiatives.
To further entrench energy reduction at all levels, the board and executive committee approved the inclusion of energy intensity measures as part of BU and employee STI KPIs. This is being piloted at Grootegeluk and, following its successful implementation, will be rolled out to all sites in 2022.
To enable our BUs to identify and achieve energy intensity reduction goals on our journey to net zero, we completed a detailed review of each key BU's energy efficiency opportunities and key focus areas for 2022. Furthermore, we have developed the Exxaro energy and carbon transition profiler tool to track fuel and electricity usage at group and BU levels and project our emissions toward the 2050 goal of carbon neutrality. The dashboard will provide routine energy usage and source apportionment information.
These initiatives support the transition to a low-carbon economy and enable our operations to improve energy efficiency by striving to achieve low-carbon footprints and optimise energy consumption.
Our BUs' primary sources of energy in 2021 were electricity (40%) and diesel (59%). In 2020, the primary sources of energy were also electricity and diesel (63% and 25% respectively). Total energy consumed decreased by 16% in 2021 to 5 441 267GJ, compared to 6 462 881GJ in 2020, attributable mainly to energy efficiency projects implemented at BUs.
Electricity and diesel intensities increased in 2021, mainly due to energy efficiency projects at our operations, particularly at Grootegeluk. As a result, section 12L tax rebates were successfully claimed at Grootegeluk in 2021 for several energy intensity reduction projects.
Based on a decrease of 10% in production tonnages in 2021, electricity intensity increased by 10% to 14.18MWh/kt and diesel intensity decreased by 2.05% to 2 000L/kt.
| Electricity | Production (kt) | Intensities (MWh/kt) | ||||||||||||||
| 2020 | 2021 | 2021 vs 2020 | 2020 | 2021 | 2021 vs 2020 | 2020 | 2021 | 2021 vs 2020 | ||||||||
| Total (group) | 605 770 | 601 717 | -0.67% | improved | 47 008 | 42 430 | -9.74% | decrease | 13 | 14.18 | 9.08% | regressed | ||||
|---|---|---|---|---|---|---|---|---|---|---|---|---|---|---|---|---|
| Mpumalanga | ||||||||||||||||
| Belfast4 | 2 904 | 15 395 | 430.13% | regressed | 2 850 | 2 520 | -11.58% | decrease | 1 | 6 | -83.33% | regressed | ||||
| Dorstfontein East | 17 286 | 11 965 | -30.78% | improved | 909 | 548 | -39.71% | decrease | 19 | 21 | -9.52% | regressed | ||||
| Dorstfontein West | 14 393 | 13 341 | -7.31% | improved | 1 104 | 954 | -13.59% | decrease | 13 | 13 | 0.00% | improved | ||||
| Forzando North | 43 795 | 29 674 | -32.24% | improved | 84 | 0 | decrease | 26 | 27 | -3.70% | regressed | |||||
| Forzando South1 | 1 594 | 1 082 | -32.12% | decrease | ||||||||||||
| Leeuwpan | 25 927 | 21 930 | -15.42% | improved | 3 720 | 2 396 | -35.59% | decrease | 7 | 9 | -22.22% | regressed | ||||
| Mafube | 26 237 | 23 476 | -10.52% | improved | 1 818 | 1 795 | -1.27% | decrease | 14 | 6 | 133.33% | improved | ||||
| Matla | 100 358 | 101 439 | 1.08% | regressed | 6 153 | 5 902 | -4.08% | decrease | 16 | 17 | -5.88% | regressed | ||||
| Limpopo | ||||||||||||||||
| Grootegeluk | 371 785 | 374 548 | 0.74% | regressed | 28 776 | 27 229 | -5.38% | decrease | 13 | 14 | -7.14% | regressed | ||||
| Tshikondeni2 | 1 651 | 775 | -53.06% | improved | – | – | – | – | – | – | ||||||
| KwaZulu-Natal | ||||||||||||||||
| Durnacol3 | 50 | 96 | 92.00% | regressed | – | – | – | – | – | – | ||||||
| Hlobane3 | 18 | 18 | 0.00% | no change | – | – | – | – | – | – | ||||||
| 1 | Electricity consumption at Forzando South is included in the Forzando North figure (consumption is for Forzando North and Forzando South, hence the calculated electricity intensity reflected for Forzando North is based on production figures for both operations). |
| 2 | Arnot was transferred to Arnot Opco Proprietary Limited during Q1 2020. |
| 3 | Closed operations |
| 4 | Regressed due to mine expansion. |
| Diesel consumption (kl) | Production (kt) | Intensities (L/kt) | ||||||||||||||
| 2020 | 2021 | 2021 vs 2020 | 2020 | 2021 | 2021 vs 2020 | 2020 | 2021 | 2021 vs 2020 | ||||||||
| Total (group) | 96 075 | 84 831.3 | -11.70% | improved | 47 008 | 42 426 | -9.75% | decrease | 2 044 | 2 000 | -2.17% | improved | ||||
|---|---|---|---|---|---|---|---|---|---|---|---|---|---|---|---|---|
| Mpumalanga | ||||||||||||||||
| Belfast | 13 100 | 10 843 | -17.23% | improved | 2 850 | 2 520 | -11.58% | decrease | 4.60 | 4.30 | -6.39% | improved | ||||
| Dorstfontein East | 7 154 | 3 454 | -51.72% | improved | 909 | 548 | -39.71% | decrease | 7.87 | 6.30 | -19.91% | improved | ||||
| Dorstfontein West | 409 | 270 | -33.99% | improved | 1 104 | 954 | -13.59% | decrease | 0.37 | 0.28 | -23.61% | improved | ||||
| Forzando north | 763 | 493 | -35.39% | improved | 84 | 0 | decrease | 9.08 | ||||||||
| Forzando South | 240 | 194 | -19.17% | improved | 1 594 | 1 082 | -32.12% | decrease | 0.15 | 0.18 | 19.08% | regressed | ||||
| Leeuwpan | 19 480 | 14 878 | -23.62% | improved | 3 720 | 2 396 | -35.59% | decrease | 5.24 | 6.21 | 18.58% | regressed | ||||
| Mafube | 4 571 | 7 454 | 63.07% | improved | 1 818 | 1 795 | -1.27% | decrease | 2.51 | 4.15 | 65.16% | regressed | ||||
| Matla | 2 073 | 2 453 | 18.33% | regressed | 6 153 | 5 902 | -4.08% | decrease | 0.34 | 0.42 | 23.36% | regressed | ||||
| Limpopo | ||||||||||||||||
| Grootegeluk | 48 189 | 44 713 | -7.21% | improved | 28 776 | 27 229 | -5.38% | decrease | 1.67 | 1.64 | -1.94% | improved | ||||
| Tshikondeni | 10 | 6.3 | -37.00% | improved | – | – | – | – | – | – | ||||||
| KwaZulu-Natal | ||||||||||||||||
| Durnacol | 39 | 20 | -48.72% | improved | – | – | – | – | – | – | ||||||
| Hlobane | 47 | 53 | 12.77% | no change | – | – | – | – | – | – | ||||||
There were no energy management grievances lodged during the year.
Our 2022 objective is to align the measurement and management of our energy goals across all our BUs. We will confirm and finalise the 2022 targets for operations, as well as clarify our five and 10-year goals, and track performance through the energy and carbon transition profiler tool and site productivity and energy management services.
In line with our renewable energy strategy, we will begin the construction of the Grootegeluk solar PV facility in 2022. The 70MW facility will be developed with Cennergi and will provide clean, secure energy and significant cost savings, and reduce our carbon footprint.
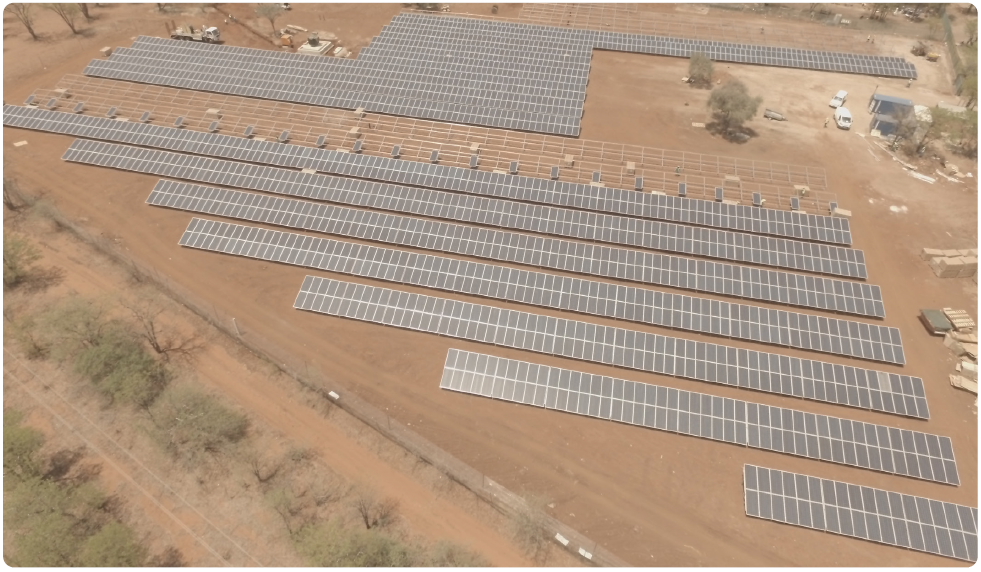
Solar installation at our Tshikondeni mine in closure
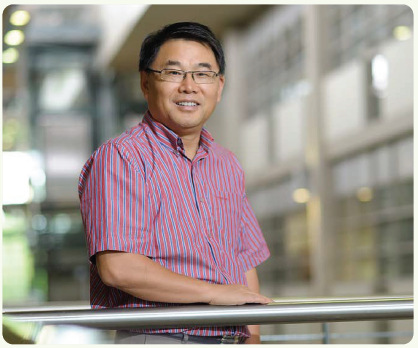
Professor Xiaohua Xia
A technical masterclass on energy efficiency and demand side management was held for all the operation engineers by Professor Xia, a professor in the electrical, electronic and computer engineering department at the University of Pretoria. The workshop was designed to raise awareness on how demand side management can be used to save costs and energy efficiency can save costs and electricity.
The outcome was a proposed framework to understand how behaviour, time and technology contribute to a successful energy management programme and planning. In the year ahead, our operations will explore this framework further, looking into aspects such as energy baselining, modelling and optimisation.
Over 30% of energy is estimated to be lost at an operational level due to inefficiencies. This masterclass is just one of the ways we are supporting our people as they look at innovative ways to solve real problems.
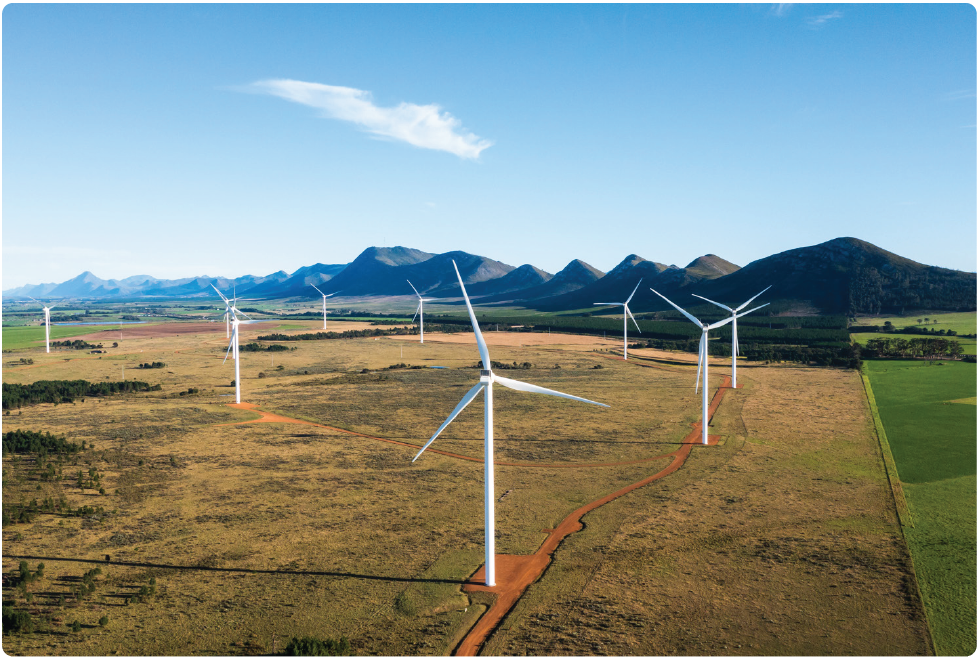
Tsitsikamma windfarm turbines in the Eastern Cape