Exxaro Resources limited
Environmental, social and governance report 2021
Our KPIs are outlined in this strategic performance dashboard.
We remain within our sustainability risk appetite and have managed our strategic objectives by monitoring our KPIs through the strategic performance dashboard. This is done quarterly by Exxaro's board and executive committee.
We ensure strategy management is integrated with:
The board and executive committee measure and manage Exxaro's strategy and performance so that stakeholders can have a transparent and consolidated view of value creation and sustainability drivers.
Built-in risk appetite thresholds enable appropriate strategic decisions.
The dashboard links strategic KPIs and our material matters to present our sustainable value creation in terms of the relationship amongst the capitals we impact. Performance indicators (out of appetite, worst tolerable, best realistic, target or opportunity) show whether KPIs are within our risk appetite thresholds.
We aim for "target", and avoid "worst tolerable" or "out of appetite" to remain within our defined risk appetite. When necessary, we implement or improve controls to ensure we achieve our strategy objectives. For example, our strategic objectives include improving operational performance using core operating margin as a KPI. We underperform when it is below best realistic.
| KPI performance | Current performance | Indicator | ||||
| Core operating margin | 25% |  |
| KPI threshold | Out of appetite | Worst tolerable | Best realistic | Target | Opportunity | ||||||||||
| Core operating margin | <15% | 15% | 15% to 20% | 20% | >20% | ||||||||||
| Indicator |  |
 |
 |
 |
|
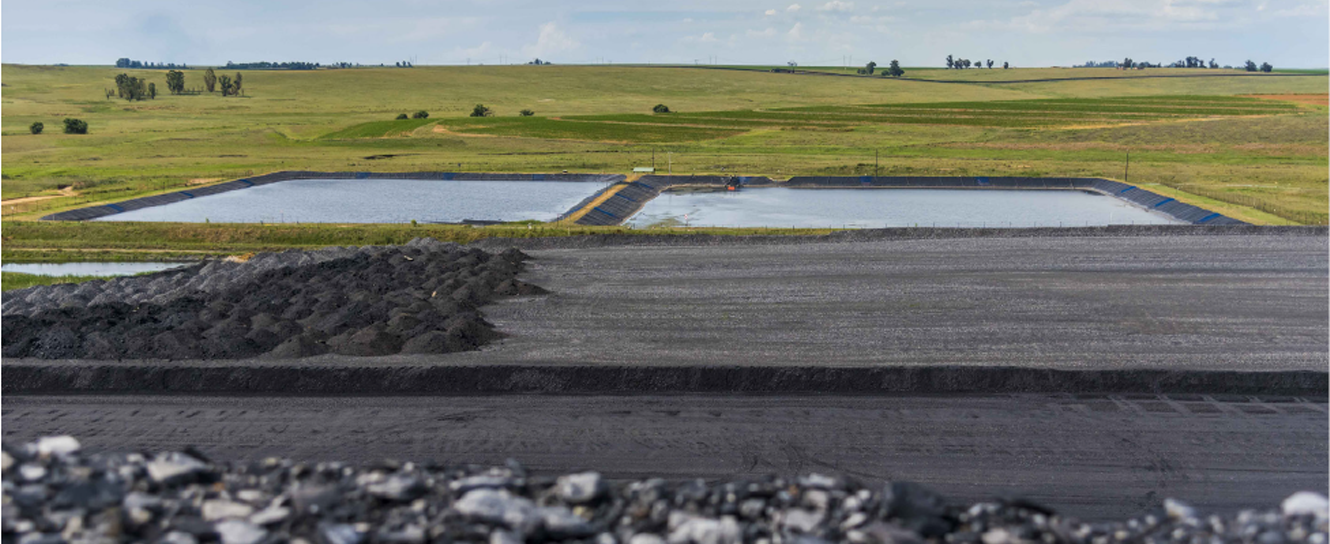
Pollution control dams at our ECC operation which Exxaro exited in September 2021
 NATURAL CAPITAL
 HUMAN CAPITAL
 SOCIAL AND RELATIONSHIP CAPITAL
 MANUFACTURED CAPITAL INTELLECTUAL CAPITAL
 FINANCIAL CAPITAL
| 2021 | 2020 | |||||||||
| KPI | Strategy | Target | Actual | Indicator | Target | Actual | Indicator | Trend based on actual data |
||
| Incidents | ||||||||||
| Reportable environmental incidents (level 2 and 3) | Become a catalyst for economic growth and environmental stewardship | 6 level 2s 0 level 3s |
0 level 2s 0 level 3s | |
6 level 2s 0 level 3s |
0 level 2s 0 level 3s |
|
 |
||
| Compliance | ||||||||||
| Stoppage directives (includes section 54 in terms of MHSA*) | Empower people to create impact | 0 | 2 | |
0 | 3 | |
 |
||
| Stoppage directives (includes directives in terms of NWA, NEMA and MPRDA**) | Become a catalyst for economic growth and environmental stewardship | 0 | 0 | |
0 | 0 | |
|
||
| Valid authorisations in place (EA, IWUL, WML, AEL, EIA ROD*** and reporting) | ||||||||||
| Current operations | Become a catalyst for economic growth and environmental stewardship | 100% | 100% | |
100% | 100% | |
|
||
| Projects | 100% | 100% | |
100% | 100% | |
|
|||
| Compliance to valid licences/authorisations in place (EA, IWUL, WML, AEL, EIA ROD*** and reporting) | ||||||||||
| Current operations | Become a catalyst for economic growth and environmental stewardship | 100% | 96% | |
100% | 96.47% | |
|
||
| Projects | Become a catalyst for economic growth and environmental stewardship | 100% | 99% | |
100% | 99.33% | |
|
||
| Environmental liability provisions in place | ||||||||||
| Commercial operations | Become a catalyst for economic growth and environmental stewardship | 80% and 80% to 100% and 100% | 72% | |
Between 80% and 100% |
69% | |
|
||
| Captive operations | Become a catalyst for economic growth and environmental stewardship | 80% and 80% to 100% and 100% | 109% | |
Between 60% and 100% |
116% | |
|
||
| Environmental management | ||||||||||
| Carbon intensity scope 1 emissions (ktCO2e) | Be carbon neutral by 2050 | Actual for previous year less 5% | 3% deterioration | |
Actual for previous year less 5% |
10% improvement | |
 |
||
| Carbon intensity scope 2 emissions (ktCO2e) | Be carbon neutral by 2050 | Actual for previous year less 5% | 11% deterioration | |
Actual for previous year less 5% |
9.6% deterioration | |
|
||
| Water intensity (kL/tonne RoM****) | Be carbon neutral by 2050 | 0.20 | 0.149 | |
0.20 | 0.182 | |
|
||
| * | Mine Health and Safety Act, 1996 (Act 29 of 1996) (MHSA). |
| ** | National Water Act, 1998 (Act 36 of 1998) (NWA), National Environmental Management Act, 1998 (Act 107 of 1998) (NEMA) and Mineral and Petroleum Resources Development Act, 2002 (Act 28 of 2002). |
| *** | Environmental authorisation (EA), integrated water use licence (IWUL), atmospheric emissions licence (AEL), environmental impact assessment (EIA) and record of decision (ROD). |
| **** | Run of mine (RoM). |
| Trend | |
|
Deteriorated |
|
Improved |
|
Unchanged |
 |
New KPI this period |
| KPI threshold | Out of appetite | Worst tolerable | Best realistic | Target | Possible waste or opportunity | ||||||||||
| Core operating margin | <15% | 15% | Between 15% to 20% |
20% | >20% | ||||||||||
| Indicator | |
|
|
|
|
| 2021 | 2020 | Trend based on threshold |
|||||||||
| KPI | Strategy | Target | Actual | Indicator | Target | Actual | Indicator | ||||
| Safety | |||||||||||
| Number of fatalities Lost-time injuries = 12 |
Empower people to create impact | 0 | 0 | |
0 | 0 | |
|
|||
| LTIFR # | Empower people to create impact | 0.11 | 0.08 | |
0.11 | 0.05 | |
|
|||
| Health Number of accepted occupational health cases = 4 |
|||||||||||
| OHIFR# reported | Empower people to create impact | 0.31 | 0.16 | |
0.31 | 0.19 | |
|
|||
| People who received HIV/Aids awareness training | Empower people to create impact | 90% to 100% | 79.3% | |
Between 90% and 100% | 84.1% | |
|
|||
| Employees who received awareness training and voluntarily tested for HIV/Aids | Empower people to create impact | 68% and above | 71.3% | |
68% and above | 47.6% | |
|
|||
| HIV/Aids prevalence rate compared to country prevalence rate | Empower people to create impact | Less than country prevalence rate | 3.7% | |
0% | 8.8% | |
|
|||
| COVID-19 infection rate compared to country infection rate | Make our minerals and energy business thrive | Equal to the country infection rate | 3.6% below the country infection rate | |
N/A | N/A | N/A |  |
|||
| COVID-19 recovery rate compared to country recovery rate | Make our minerals and energy business thrive | Equal to the country recovery rate | 3% more than the country recovery rate | |
N/A | N/A | N/A | |
|||
| Skills | |||||||||||
| Skills provision (% of internal appointments for critical skills) | Empower people to create impact | 60% | 62.17% | |
60% | 88.4% | |
|
|||
| Scarcity skills retention | Empower people to create impact | 5% | 3.7% | |
5% | 3.6% | |
|
|||
| Security | |||||||||||
| Fraud and corruption/asset destruction | Empower people to create impact | 0% | 0% | |
0% | 0% | |
|
|||
| # | Lost-time injury frequency rate (LTIFR) and occupational health incident frequency rate (OHIFR). |
| * | The HIV/Aids stats above are from quarter 4 only and the annual percentage for people who received the HIV/Aids awareness and training stands at 111% and employees who received the awareness training and voluntarily tested for HIV stands at 61%. |
| Trend | |
|
Deteriorated |
|
Improved |
|
Unchanged |
|
New KPI this period |
| KPI threshold | Out of appetite | Worst tolerable | Best realistic | Target | Possible waste or opportunity | ||||||||||
| Core operating margin | <15% | 15% | 15% to 20% | 20% | >20% | ||||||||||
| Indicator | |
|
|
|
|
| 2021 | 2020 | Trend based on actual data |
|||||||||
| KPI | Strategy | Target | Actual | Indicator | Target | Actual | Indicator | ||||
| Employment equity | |||||||||||
| Black ownership at group level | Become a catalyst for economic growth and environmental stewardship | 30.1% | 47.1% | |
30.1% | 38.22% | |
|
|||
| People living with disabilities | Empower people to create impact | 1.5 | 1.59 | |
1.5 | 1.44 | |
|
|||
| Human resources development spend as % of payroll - Mining Charter III | Empower people to create impact | 5% | 5.51% | |
5% | 4.92% | |
|
|||
| HDP& representation - top management | Empower people to create impact | 50 | 66.66 | |
50 | 66.67 | |
|
|||
| HDP representation - senior management | Empower people to create impact | 60 | 65 | |
60 | 57.95 | |
|
|||
| HDP representation - middle management | Empower people to create impact | 60 | 78.52 | |
60 | 74.49 | |
|
|||
| HDP representation - junior management | Empower people to create impact | 70 | 79.52 | |
70 | 78.15 | |
|
|||
| Women representation in top management bands | Empower people to create impact | 20% | 33.33% | |
20% | 33.33% | |
|
|||
| Women representation in senior management bands | Empower people to create impact | 25% | 20.48% | |
25% | 19.32% | |
|
|||
| Women representation in middle management bands | Empower people to create impact | 25% | 38.19% | |
25% | 36.16% | |
|
|||
| Women representation in junior management bands | Empower people to create impact | 30% | 29.25% | |
30% | 26.12% | |
|
|||
| Business sustainability | |||||||||||
| B-BBEE level | Empower people to create impact | Level 1 | Level 2 | |
Level 1 | Level 2 | |
|
|||
| Enterprise development (% of NPAT& ) | Empower people to create impact | 1% | 0.308% | |
1% | 0.45% | |
|
|||
| Supplier development (% of NPAT) | Empower people to create impact | 2% | 0.694% | |
2% | 0.86% | |
|
|||
| Socio-economic development (% of NPAT) | Empower people to create impact | 1% | 0.56% | |
1% | 1.23% | |
|
|||
| Human resources development spend for black people as % of payroll - B-BBEE | Empower people to create impact | 3% | 3.20% | |
3% | 3.19% | |
|
|||
| SLPs@ | |||||||||||
| Project delivery measure - local economic development projects per SLP time variance from plan | Become a catalyst for economic growth and environmental stewardship | 0% behind schedule | 8% | |
0% behind schedule | 11% | |
|
|||
| Cost variance from plan | Become a catalyst for economic growth and environmental stewardship | 0% over budget | 19% | |
0% over budget | 59% | |
 |
& Historically disadvantaged persons (HDP) and net profit after tax (NPAT).
| Trend | |
|
Deteriorated |
|
Improved |
|
Unchanged |
|
New KPI this period |
| KPI threshold | Out of appetite | Worst tolerable | Best realistic | Target | Possible waste or opportunity | ||||||||||
| Core operating margin | <15% | 15% | 15% to 20% | 20% | >20% | ||||||||||
| Indicator | |
|
|
|
|
| 2021 | 2020 | Trend based on actual data |
|||||||||
| KPI | Strategy | Target | Actual | Indicator | Target | Actual | Indicator | ||||
| Capital project delivery measure | |||||||||||
| Capital projects time overrun | Make our minerals and energy businesses thrive | 0% behind schedule | 10.3 | |
0% behind schedule | 11.1 | |
|
|||
| Capital projects cost overrun | Make our minerals and energy businesses thrive | 0% over budget | 3 | |
0% over budget | 6.3 | |
|
|||
| Operational performance | |||||||||||
| System availability (Core P1 and ERP Solutions) | Make our minerals and energy businesses thrive | 97 | 99 | |
97 | 98 | |
|
|||
| Digitalisation programmes (cost overrun) | Make our minerals and energy businesses thrive | 0% over budget | 0% | |
0% over budget | 0% | |
|
|||
| Digitalisation programmes (time overrun) | Make our minerals and energy businesses thrive | 0% behind schedule | 0% | |
0% behind schedule | 9% | |
|
| Trend | |
|
Deteriorated |
|
Improved |
|
Unchanged |
|
New KPI this period |
| KPI threshold | Out of appetite | Worst tolerable | Best realistic | Target | Possible waste or opportunity | ||||||||||
| Core operating margin | <15% | 15% | Between 15% to 20% |
20% | >20% | ||||||||||
| Indicator | |
|
|
|
|
| 2021 | 2020 | Trend based on actual data |
|||||||||
| KPI | Strategy | Target | Actual | Indicator | Target | Actual | Indicator | ||||
| Core operating margin | Make our minerals and energy businesses thrive | 20% | 21% | |
20% | 17% | |
|
|||
| Core ROCE@ excluding Cennergi | Make our minerals and energy businesses thrive | 20% | 40% | |
20% | 27% | |
|
@Social and labour plans (SLPs) and return on capital employed (ROCE).
| Trend | |
|
Deteriorated |
|
Improved |
|
Unchanged |
|
New KPI this period |
| KPI threshold | Out of appetite | Worst tolerable | Best realistic | Target | Possible waste or opportunity | ||||||||||
| Core operating margin | <15% | 15% | Between 15% to 20% |
20% | >20% | ||||||||||
| Indicator | |
|
|
|
|