Exxaro Resources Limited
Integrated report 2022
Riaan Koppeschaar
Finance director

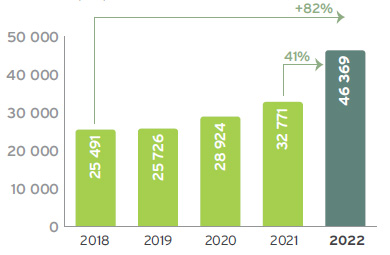
Revenue of
R46.4 billion
up 41%
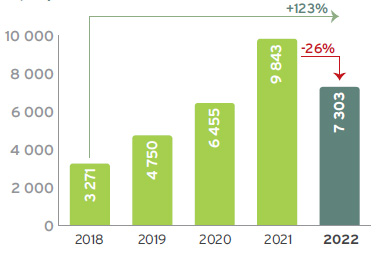
Adjusted equity-accounted income of
R7.3 billion
down 26%
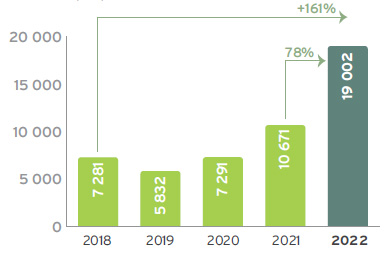
Cash generated
by operations at
R18.9 billion
up 79%
EBITDA of
R19.0 billion
up 78%
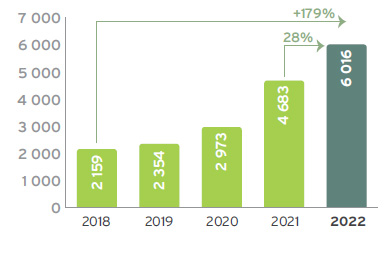
Headline earnings of
R60.16 per share
up 28%
Total ordinary dividend declared of
R27.29 per share
down 16%
The strong commodity price performance together with our operational excellence efforts have contributed positively to our financial performance. Despite the logistical constraints, our managed operations were able to show strength and resilience resulting in a 78% increase in EBITDA to R19.0 billion. The contribution from our non-controlled operations showed a decrease with adjusted equity-accounted income decreasing 26% to R7.3 billion, mainly due to the performance of SIOC. This translated into basic HEPS rising to R60.16 compared to R46.83 in 2021. We are pleased to have declared a final ordinary dividend to shareholders of R11.36 per share, bringing the total dividend for the year to R27.29 per share.


After a strong finish to 2021, the global economic expansion lost momentum during 2022. The growth rate in 2021 of 5.8% decreased to 2.8% in 2022. As financial market conditions deteriorated during the second half of 2022, the global economy remained at its highest vulnerability, with the risk of a global economic recession emerging.
During 2022, our supply into global thermal coal markets was influenced by the Indonesian government's temporary ban on exports, inclement weather conditions, rail challenges in South Africa and labour issues in Australia. In addition, the Russia-Ukraine conflict sent global markets into turmoil as Europe's energy insecurity surfaced, which, among others, favoured South African seaborne thermal coal trade as international sanctions for Russian coal came into effect. For most of the year, the tight global gas market remained supportive to thermal coal demand and prices.
Despite the property sector weakness and widespread renewed COVID-19 lockdowns in China, the iron ore market started off the year relatively stable, supported by strong Chinese steel production. The iron ore market softened during April/May, with sentiment strengthening towards the end of the first half of 2022 from new stimulus measures and due to the easing of lockdown restrictions by the Chinese government. Weak demand sentiment in both China and Europe and global recession risks are expected to weigh on the iron ore market for the remainder of the year.
For a better understanding of the comparability of results between the two reporting periods, we have adjusted our financial results for non-recurring items (referred to as non-core adjustments) to derive our adjusted financial results. The non-core adjustments in both 2022 and 2021 are the same as the headline earnings adjustments, resulting in no differences in EBITDA and headline earnings, respectively.
Revenue (Rm)
EBITDA (Rm)
Equity income (Rm)
HEPS (cents)
*Adjusted for non-core items.
Group revenue increased 41% to R46 369 million (2021: R32 771 million), mainly due to the exceptional performance of the coal business driven by higher export and domestic sales prices, despite the ongoing logistical challenges.
The revenue contribution from our energy business was 3% lower than 2021 due to persistent low wind conditions experienced during the past 12 months both in South Africa and across Europe.
Group EBITDA increased by 78% to R19 002 million (2021: R10 671 million), mainly attributable to a 78% increase in coal EBITDA.
The main drivers for the 78% increase in group EBITDA are provided in the graph below.
Group EBITDA – record EBITDA despite cost pressures (Rm)
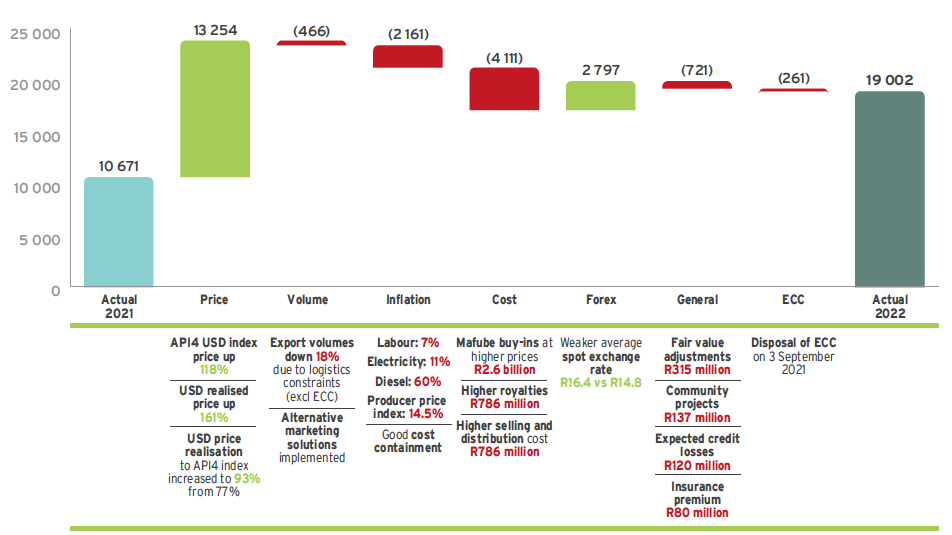
We realised higher prices on our products in line with higher international coal prices. We are particularly proud of our price realisation of 93% compared to the API4 price index, which underscores the value of our early value coal strategy to render a high-quality product mix, enabling us to respond to changing market conditions.
As a result of logistical constraints, our export volumes decreased by 18% (excluding ECC) but through our concerted efforts, we were able to mitigate some of the losses through alternative logistical solutions including the use of alternative ports as well as trucking of coal.
2022 was characterised by double digit inflation growth in the mining sector but we were able to limit our cost increases to 12.7% for our coal operations as we continue to realise the benefits from our digital and operational excellence programmes.
Inflationary pressure on costs was mainly driven by diesel tariff increases that were significantly higher than the producer price index inflation rate.
Operational costs increased in line with higher production, and we bought in more coal from Mafube at higher prices.
Royalties increased in line with higher revenue as well as lower capital expenditure to offset against the revenue.
Selling and distribution costs increased due to the alternative logistical solutions we implemented.
The net positive forex variance is due to the impact of the weaker rand/US dollar exchange rate on realised and unrealised forex differences on foreign debtors and cash balances.
Included under general expenses are negative fair value adjustments on forward exchange contracts (FECs) and the environmental rehabilitation funds, higher spend on community projects, higher provision for expected credit losses as well as a higher insurance premium paid.
ECC, which was disposed of on 3 September 2021, is stripped out for comparability purposes.
Adjusted equity-accounted income from associates and joint ventures decreased by 26% to R7 303 million (2021: R9 843 million).
| Adjusted equity-accounted income/(loss) | Dividends received | |||||
| 2022 Rm |
2021 Rm |
Change % |
2022 Rm |
2021 Rm |
Change % |
|
| Coal: Mafube | 1 902 | 375 | 407 | 750 | 100 | |
|---|---|---|---|---|---|---|
| Coal: Tumelo1 | 29 | (100) | ||||
| Coal: RBCT | (9) | (18) | 50 | |||
| Ferrous: SIOC | 4 902 | 9 035 | (46) | 5 153 | 9 991 | (48) |
| TiO2: Tronox SA2 | 54 | (100) | ||||
| Other: Black Mountain | 578 | 352 | 64 | |||
| Other: LightApp | (70) | 16 | (538) | |||
| Total | 7 303 | 9 843 | (26) | 5 903 | 9 991 | (41) |
| 1 | Disposed on 3 September 2021 as part of ECC disposal transaction. |
| 2 | 2021 equity-accounted income up to the date of disposal on 24 February 2021. |
The significant increase (+407%) in adjusted equity-accounted income from Mafube, our 50% joint venture with Thungela, was driven by higher export coal prices realised on higher sales volumes.
The 46% decrease in adjusted equity-accounted income from SIOC to R4 902 million (2021: R9 035 million) was primarily driven by lower market prices and volumes, as well as higher operating expenses, which were partially offset by a weaker currency.
An interim dividend of R2 498 million was received from our investment in SIOC in August 2022 (second half 2021: R6 329 million). SIOC declared a final dividend to its shareholders in February 2023. Exxaro's share of the dividend amounts to R1 419 million, which is 43% lower than the interim dividend received. The dividend will be accounted for in the first half of 2023.
The increase in the adjusted equity-accounted income of Black Mountain is mainly due to higher sales volumes at higher prices for zinc, lead, copper and silver.
The strong contribution from our managed operations together with the contribution from our non-controlled operations resulted in a 26% increase in headline earnings to R14 558 million (2021: R11 568 million).
There was a decrease in the weighted average number of shares to 242 million (2021: 247 million) due to the shares that were bought back in 2021 as part of the share repurchase programme.
The increase in headline earnings, together with the lower weighted average number of shares translates to a record basic HEPS of 6 016 cents per share (2021: 4 683 cents per share), 28% higher than the prior year.
In terms of our capital allocation framework, free cash flow generated will be prioritised per the diagram below:
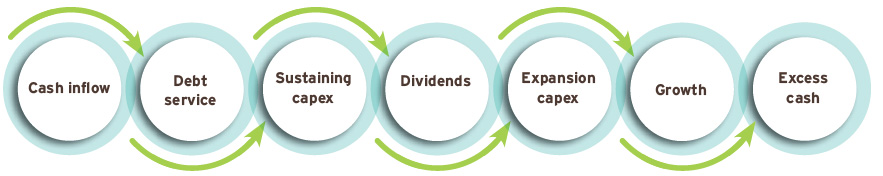
The diagram represents the order of our capital allocation framework. In applying our capital allocation framework, we aim for a gearing ratio of below 1.5 times net debt (excluding ring-fenced project financing) to EBITDA. The capital allocation framework is in line with our commitment to sustainably returning cash to shareholders through the cycle while retaining a strong financial position.
During 2022, we received cash of R20.6 billion (2021: R25 billion which included R5.8 billion proceeds from the disposal of our investment in Tronox Holdings plc in 2021), comprising R14.7 billion from our operations (net of tax paid) (2021: R9.2 billion) and dividend income received from our equity-accounted investments of R5.9 billion (2021: R10.0 billion).
In terms of our capital allocation framework, we then utilised this cash to mainly:
Given our net cash position (excluding ring-fenced project financing) at 31 December 2022 and 31 December 2021, our net debt to EBITDA cover ratio was well below our target of 1.5 times.
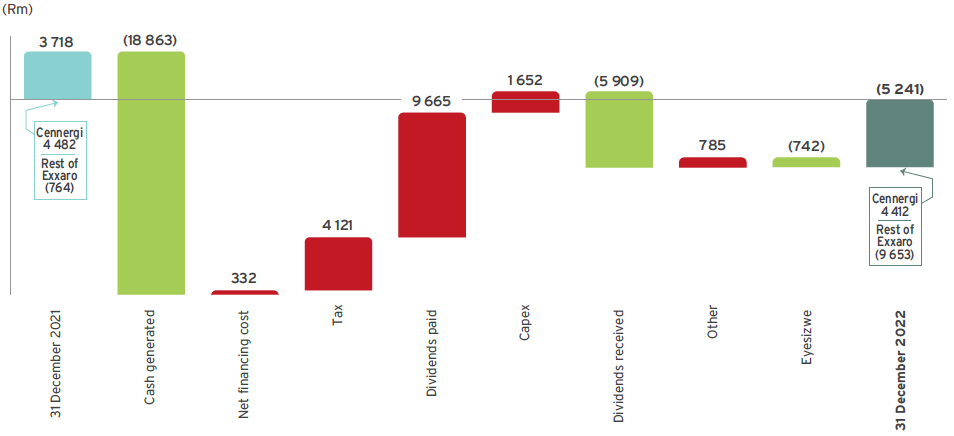
Exxaro remains in a strong liquidity position with a net cash balance of R5.2 billion as at 31 December 2022 (2021: net debt of R3 718 million) and undrawn borrowing facilities and maturities as set out below. If the Cennergi net debt is excluded, the net cash position at 31 December 2022 was R9.7 billion (2021: R764 million).
| Facilities available | |||
| Drawn Rm |
Undrawn/ committed Rm |
Undrawn/ unissued Rm |
|
| Term loan and revolving facility | 3 850 | 3 250 | |
|---|---|---|---|
| Domestic Medium-Term Note programme | 643 | 4 000 | |
| Interest-bearing borrowings | 4 493 | ||
| Interest capitalised | 60 | ||
| Lease liabilities | 420 | ||
| Capitalised transaction costs | (14) | ||
| Total interest-bearing debt | 4 959 | ||
| Current | 544 | ||
| Non-current | 4 415 | ||
| Net cash and cash equivalents | (14 612) | ||
| Net cash | (9 653) | ||
| Maturity profile of debt |
|
| Repayment period | 4 959 |
|---|---|
| Less than 6 months | 301 |
| 6 – 12 months | 243 |
| 1 – 2 years | 1 139 |
| 2 – 3 years | 508 |
| 3 – 4 years | 2 564 |
| 4 – 5 years | 80 |
| > 5 years | 124 |
| Facilities available | ||
| Drawn Rm |
Undrawn/ committed Rm |
|
| Project financing | 4 551 | 410 |
|---|---|---|
| Interest-bearing borrowings | 4 551 | |
| Interest capitalised | 3 | |
| Lease liabilities | 58 | |
| Total interest-bearing debt | 4 612 | |
| Net cash and cash equivalents | (200) | |
| Net debt | 4 412 | |
| Maturity profile of debt |
|
| Repayment period | 4 612 |
|---|---|
| Less than 6 months | 95 |
| 6 – 12 months | 116 |
| 1 – 2 years | 273 |
| 2 – 3 years | 349 |
| 3 – 4 years | 449 |
| 4 – 5 years | 555 |
| > 5 years | 2 775 |
Value distribution (Rm)
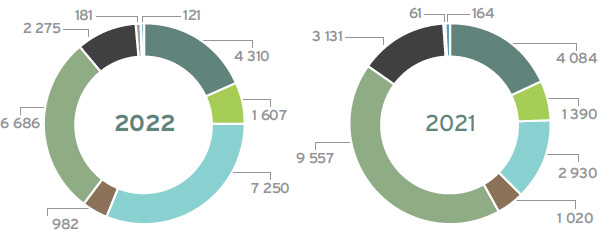
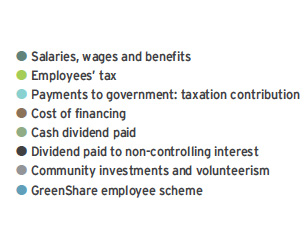
The value generated by Exxaro is distributed to its various stakeholders as follows:
All stakeholders benefit from continuous reinvestment into the group to ensure sustainability and expansion.
| 2022 Rm |
2021 Rm |
|
| Assets | ||
| Non-current assets | 63 357 | 63 298 |
| Property, plant and equipment | 37 446 | 38 351 |
| Intangible assets | 2 760 | 2 927 |
| Right-of-use assets | 352 | 401 |
| Inventories | 176 | 145 |
| Equity-accounted investments | 18 060 | 17 322 |
| Financial assets | 3 539 | 3 237 |
| Deferred tax | 254 | 369 |
| Other assets | 770 | 546 |
| Current assets | 21 788 | 12 419 |
| Inventories | 1 728 | 1 606 |
| Financial assets | 376 | 311 |
| Trade and other receivables | 4 199 | 2 701 |
| Cash and cash equivalents | 14 812 | 7 042 |
| Current tax receivables | 101 | 24 |
| Other assets | 572 | 735 |
| Total assets | 85 145 | 75 717 |
| Equity and liabilities | ||
| Capital and other components of equity | ||
| Share capital | 983 | 983 |
| Other components of equity | 1 700 | 1 560 |
| Retained earnings | 44 136 | 37 007 |
| Equity attributable to owners of the parent | 46 819 | 39 550 |
| Non-controlling interests | 12 560 | 10 548 |
| Total equity | 59 379 | 50 098 |
| Non-current liabilities | 20 574 | 20 841 |
| Interest-bearing borrowings | 8 378 | 9 255 |
| Lease liabilities | 438 | 470 |
| Other payables | 25 | 53 |
| Provisions | 2 762 | 2 201 |
| Retirement employee obligations | 165 | 159 |
| Financial liabilities | 112 | 406 |
| Deferred tax | 8 668 | 8 271 |
| Other liabilities | 26 | 26 |
| Current liabilities | 5 192 | 4 778 |
| Interest-bearing borrowings | 715 | 1 000 |
| Lease liabilities | 40 | 34 |
| Trade and other payables | 3 340 | 2 230 |
| Provisions | 179 | 101 |
| Financial liabilities | 5 | |
| Overdraft | 1 | |
| Current tax payables | 143 | 418 |
| Other liabilities | 770 | 994 |
| Total liabilities | 25 766 | 25 619 |
| Total equity and liabilities | 85 145 | 75 717 |
Property, plant and equipment decreased by R905 million when compared to the corresponding period last year, which includes R1 401 million spend on sustaining capex (stay-in-business capex) and R251 million on expansion capex, offset by depreciation charges of R2 457 million. The net movement further included borrowing costs capitalised.
The graph below summarises key movements in the net debt balance for the year ended 31 December 2022.
Group results – net debt/(cash)
(Rm)
Exxaro initiated the Leeuwpan divestment process as part of its ongoing portfolio optimisation strategy to ensure the future resilience of our coal business. Unfortunately, progress on the divestment stalled and the process was stopped in the third quarter of 2022 to ensure stability at the mine. Exxaro will continue to review its coal assets and projects in line with its strategic goals.
Exxaro continues to evaluate its options to dispose of its 26% shareholding in Black Mountain.
The achievement of our financial KPIs is presented in the table below.
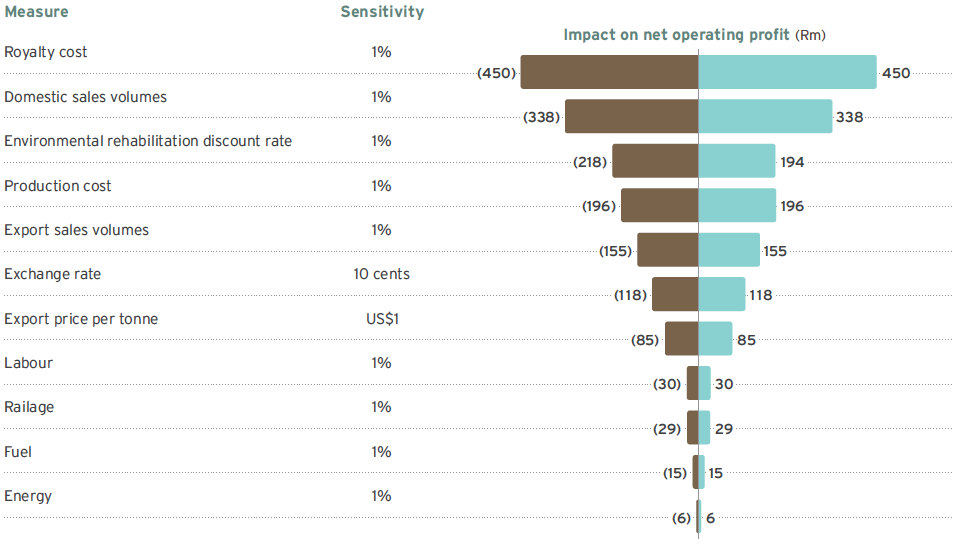
All internal KPIs are well within target, indicating a healthy balance sheet and strong cash flow generation. The impact of various coal sensitivity measures as well as the key financial risk factors can be further used to stress test our current headroom.
The group has complied with all the below mentioned bank covenants for the year ended 31 December 2022 and the previous financial year.
| Target | 2021 | 2022 | |
| Internal KPIs | |||
| EBITDA interest cover*# (times) | >4 | 75 | |
| Net debt/(cash): equity* (%) | <40 | (2) | (17) |
| Net debt: EBITDA*## (times) | <1.5 | ||
| Return on total capital employed (%) | >20 | 36 | 45 |
| Bank covenants** | |||
| Net debt/(cash): equity (%) | <80 | (1) | (16) |
| EBITDA interest cover# (times) | >4 | 35 | |
| Net debt: EBITDA## (times) | <3 |
| * | Excluding Cennergi consolidated results. |
| ** | Including dividends received from associates and contingent liabilities, except DMRE guarantees and excluding Cennergi consolidated results. |
| # | Exxaro is in a net finance income poasition in 2022. |
| ## | Exxaro is in a net cash position. |
The project financing debt under Cennergi is subject to the following financial covenants which have been achieved for both 2022 and 2021:
| 1 | The ratio of A to B where, A is the aggregate cash flow available for debt service (CFADS) less taxes and B is the aggregate of the finance costs, in each case for the relevant calculation period. |
| 2 | The ratio of A to B where, A is the net present value of forecast CFADS from such calculation date to (and including) the final scheduled repayment date, discounted at the discount rate (as produced by the financial model) and B is the aggregate of the facility outstanding on such calculation date. |
| 3 | The ratio of A to B where, A is the net present value of forecast CFADS from such calculation date to the end of the tenor of the PPA discounted at the discount rate and B is the aggregate of facility outstanding as at such calculation date. |
| 1 | The ratio of CFADS to senior debt service for that period. |
| 2 | The ratio of the applicable total present value amount, as at that measurement date to the sum of (i) the senior facility outstanding and (ii) all the IFC facility outstanding, as calculated and produced by the financial model, as part of the forecast for that measurement date. |
| 3 | The ratio of CFADS to total senior debt service for that period. |
| 4 | The ratio of the applicable total present value amount, as at that measurement date to total facility outstanding, as calculated and produced by the financial model, as part of the forecast for that measurement date. |
The following diagram indicates key sensitivities on the coal net operating profit.
The group's corporate treasury function predominantly provides financial risk management services to the business, coordinates access to domestic and international financial markets, and monitors and manages the financial risks relating to the operations of the group through internal risk reports that analyse exposure by degree and magnitude of risks. These risks include market risk (including foreign currency risk, interest rate risk and price risk), credit risk and liquidity.
In managing its capital, the group focuses on a sound net debt position, return on shareholders' equity (or ROCE) and the level of dividends to shareholders. The group's policy is to cover its annual net funding requirements through long-term loan facilities with maturities spread over time. Neither the company nor any of its subsidiaries are subject to externally imposed capital requirements.
Market risk is the risk that changes in market prices, such as foreign exchange rates, interest rates, commodity prices and equity prices, will affect profit or the value of its holdings of financial instruments.
The objective of market risk management is to manage and control market risk exposure within acceptable parameters, while optimising the return on risk.
The group's activities expose it primarily to the financial risks of foreign currency exchange rates, commodity prices, interest rates and changes in the environmental rehabilitation fund and portfolio investment quoted prices.
The group's exposure to price risk in relation to quoted prices of the environmental rehabilitation funds and portfolio investments is not considered a significant risk as the funds are invested with reputable financial institutions in accordance with a strict mandate to ensure capital preservation and growth. The funds are held for strategic purposes rather than trading purposes.
Certain transactions are denominated in foreign currencies, hence exposures to exchange rate fluctuations arise. The currency in which transactions are entered into is mainly denominated in US dollar, euro and Australian dollar. Exchange rate exposures are managed within approved policy parameters utilising FECs, currency options and currency swap agreements.
The group maintains a fully covered exchange rate position in respect of foreign loan balances (if any) and imported capital equipment resulting in these exposures being fully converted to rand. Trade-related import exposures are managed through the use of economic hedges arising from export revenue as well as through FECs. Trade-related export exposures are hedged using FECs and currency options with specific focus on short-term receivables.
Uncovered cash and cash equivalents amounted to US$32.89 million (2021: US$49.85 million).
Monetary items have been translated at the closing rate at the last day of the reporting period.
The FECs that are used to hedge foreign currency exposure mostly have a maturity of less than one year from the reporting date. When necessary, FECs are rolled over at maturity.
| 2022 | 2021 | |||||
| Average spotrate |
Average achieved rate |
Closing spot rate |
Average spot rate |
Average achieved rate |
Closing spot rate |
|
| US$ | 16.37 | 16.63 | 16.98 | 14.78 | 14.88 | 15.94 |
|---|---|---|---|---|---|---|
| € | 17.19 | 18.10 | 17.47 | 18.04 | ||
| AU$ | 11.34 | 11.49 | 11.11 | 11.55 | ||
The group is exposed to interest rate risk as it borrows and deposits funds at floating interest rates on the money market and extended bank borrowings. The group's main interest rate risk arises from long-term borrowings with floating rates, which expose the group to cash flow interest rate risk. The risk is managed by undertaking controlled management of the interest structures of the investments and borrowings, maintaining an appropriate mix between fixed and floating interest rate facilities in line with the interest rate expectations. The group also uses interest rate swaps and interest rate forwards to manage the interest rate risk exposure.
When the contractual terms of the borrowings and covenants thereof require the use of hedging instruments to mitigate the risk of fluctuations of the underlying interest rate risk cash flow exposure and the impact on profit or loss of specific projects being financed, the group looks to apply hedge accounting where an effective hedge relationship is expected and to the extent that such exposure poses a real risk to the achievement of the loan covenants.
The financial institutions chosen are subject to compliance with the relevant regulatory bodies.
The loan facility and bonds were entered into at floating interest rates.
The interest rate repricing profile for the loan facility and bonds is summarised below:
| 1 to 6 months Rm |
Total borrowings Rm |
|
| At 31 December 2022 | ||
| Non-current interest-bearing borrowings: loan facility and bond | (4 034) | (4 034) |
| Current interest-bearing borrowings: loan facility and bond | (505) | (505) |
| Total interest-bearing borrowings: loan facility and bond | (4 539) | (4 539) |
| Total borrowings (%) | 100 | 100 |
| At 31 December 2021 | ||
| Non-current interest-bearing borrowings: loan facility and bond | (4 704) | (4 704) |
| Current interest-bearing borrowings: loan facility and bond | (851) | (851) |
| Total interest-bearing borrowings: loan facility and bond | (5 555) | (5 555) |
| Total borrowings (%) | 100 | 100 |
The group is exposed to the risk of variability in future interest payments on the project financing, attributable to fluctuations in the three-month Johannesburg Interbank Average Rate. The designated hedged item is the group of forecast floating interest rate cash flows arising from the project financing, up to the notional amount of each interest rate swap, over the term of the hedging relationship. The notional amounts per interest rate swap match up to the designated exposure being hedged.
Where all relevant criteria are met, hedge accounting is applied to remove the accounting mismatch between the hedging instrument and the hedged item. This will effectively result in recognising interest expense at a fixed interest rate for the hedged project financing.
The exposure profile is summarised as follows:
| Group | ||||
| Percentage exposure | ||||
| At 31 December | 2022 % |
2021 % |
2022 Rm |
2021 Rm |
| Project financing nominal amount | 100 | 100 | (4 554) | (4 700) |
|---|---|---|---|---|
| – Linked to fixed rate | 3 | 3 | (141) | (145) |
| – Linked to floating rate | 97 | 97 | (4 413) | (4 555) |
| Project financing nominal amount linked to floating rate | 97 | 97 | (4 413) | (4 555) |
| Interest rate swap notional amount (swap floating rate to fixed rate) | (81) | (81) | 3 691 | 3 808 |
| Effective floating rate exposure on project financing1 | 16 | 16 | (722) | (747) |
| 1 | Represents 40% exposure on the Tsitsikamma SPV project financing. |
Liquidity risk is the risk that the group will not be able to meet its financial obligations as they fall due. The group's approach to managing liquidity is to ensure, as far as possible, that it will always have sufficient liquidity to meet its liabilities when due, under normal and stressed conditions, without incurring unacceptable losses or risking damage to the group's reputation.
The ultimate responsibility for liquidity risk management rests with the board of directors, which has built an appropriate liquidity risk management framework for the management of the group's short, medium and long-term funding and liquidity management requirements.
The group manages liquidity risk by monitoring forecast cash flows in compliance with loan covenants and ensuring that adequate unutilised borrowing facilities are maintained.
Borrowing capacity is determined by the board of directors, from time to time.
| Group | ||
| 2022 Rm |
2021 Rm |
|
| Amount approved | 58 524 | 49 438 |
|---|---|---|
| Total borrowings | (9 093) | (10 255) |
| Unutilised borrowing capacity | 49 431 | 39 183 |
The group's capital base, the borrowing powers of the company and the group were set at 125% of shareholders' funds for both the 2022 and 2021 financial years.
To avoid incurring interest on late payments, financial risk management policies and procedures are entrenched to ensure the timeous matching of orders placed with goods received notes or services acceptances and invoices.
Credit risk relates to potential default by counterparties on cash and cash equivalents, loans, investments, trade receivables and other receivables.
The group limits its counterparty exposure arising from money market and derivative instruments by only dealing with well-established financial institutions of high credit standing. The group's exposure and the credit ratings of its counterparties are continuously monitored, and the aggregate value of transactions concluded are spread among approved counterparties. Credit exposure is controlled by counterparty limits that are reviewed and approved by the audit committee annually.
Exxaro has concentration risk as a result of its exposure to one major customer. This is, however, not considered significant as the customer adheres to the stipulated payment terms.
Exxaro establishes an allowance for non-recoverability or impairment that represents its estimate of expected credit losses in respect of trade receivables, other receivables, loans, cash and cash equivalents and investments. The main components of these allowances are a 12-month expected credit loss component that results from possible default events within the 12 months after the reporting date and a lifetime expected credit loss component that results from all possible default events over the expected life of a financial instrument.
Expected credit loss allowances increased by 76% to R183 million (2021: R104 million). The increase mainly relates to ESD loan recipients struggling to keep up with payments. The ESD committee is renegotiating payment terms for some of these loans. ESD loans to the value of R1.6 million have been written off at 31 December 2022.
The carrying amount of financial assets represents the maximum credit exposure. None of the financial assets were held as collateral for any security provided.
The aggressive nature of the interest rate increases by central banks globally, on the back of stubbornly high inflation rates, has moderated the global economic outlook for 2023 to fall short of the potential growth levels. The United Kingdom and broader Europe specifically run the risk of a recession, and any new major economic shocks could tip the world economy into a global recession. However, the relaxation of China's strict COVID-19 and real estate sector policies are expected to support the Chinese and global economic activity.
South Africa's subdued economic performance in 2022 reflected the lingering effects of the unrest in July 2021, the extensive flooding in April 2022 and slowing global growth, alongside the structural constraint of inadequate electricity supply. Energy reforms are underway, with tangible commitments expressed by potential investors. Speedy and judicious implementation could raise private investment, aiding economic activity.
The rand/US dollar exchange rate is expected to remain volatile during the first half of 2023.
The heightened European interest in South African thermal coal is expected to remain well into 2023, as Europe continues to find solutions to be independent from Russian energy sources. South African thermal coal exports into high caloric value markets, such as South Korea and Japan, present further opportunities for Exxaro. The expected global gas trade flows and market prices, post the European winter months, are expected to remain supportive of seaborne thermal coal demand and prices. Stronger demand from the Pacific is expected as South African coal continues to trade at a discount to Australian coal.
Supply tightness and higher prices in the seaborne thermal coal markets spilled over into the South African domestic market and are expected to support domestic prices into 2023. The domestic market demand for both sized and unsized product is still strong, despite declines in export pricing. Although pricing has held up compared to the export market, indications of pricing pressures are seen for products destined for export. Consequently, domestic market participants are experiencing margin squeeze when trucking coal to alternative ports, as export prices are declining.
For the iron ore market, increasing steel demand and the seasonal low iron ore supply from Australia and Brazil, due to rainy weather, will support seaborne prices in the first quarter of 2023. In the latter part of the first half of 2023, further support is expected from the positive market sentiment amid China's economic revival.
 Operational performance
Given the ongoing challenges with rail performance, the business continues to respond with our market to resource optimisation strategy, ensuring continued operations and diversified export flows by trucking coal to alternative loading stations and ports. We continue to evaluate alternative logistical options to evacuate our export product.
Riaan Koppeschaar
Finance director
14 April 2023