Exxaro Resources Limited
Integrated report 2021

Riaan Koppeschaar Finance director
Revenue of
R32.8 billion
up 13%
Core EBITDA of
R10.7 billion
up 46%
Core equity-accounted income of
R9.8 billion
up 52%
Cash generated by operations at
R10.6 billion
up 36%
Core headline earnings of
R46.83 per share
up 58%
Record total ordinary dividend of
R32.52 per share
up 72%
The strong commodity price performance and our operational excellence efforts have contributed positively to our financial performance. Despite the logistical constraints, our managed operations were able to show strength and resilience, resulting in a 46% increase in core EBITDA to R10.7 billion. The contribution from our non-controlled operations showed a significant increase with core equity-accounted income increasing 52% to R9.8 billion, mainly due to the performance of SIOC. This translated into core HEPS rising to R46.83 compared to R29.73 in 2020. We are pleased to have declared a final ordinary dividend to shareholders of R11.75 per share, bringing the total ordinary dividend for the year to a record R32.52 per share.
During the second quarter of 2021, global economic activity reached an important milestone, surpassing the pre-COVID-19 pandemic real GDP peak attained in the fourth quarter of 2019. The global economic expansion lost momentum in the third quarter of 2021, as new waves of COVID-19 infections dampened consumer sentiment and halted production. However, after a 3.4% contraction in 2020, global real GDP increased by 5.6% in 2021: its strongest advance since 1973.
The implementation of domestic Chinese policy impacted global thermal coal and iron ore markets. As the world economy recovered from the COVID-19 pandemic-induced slowdown and COVID-19 vaccinations significantly gained momentum, global energy demand increased, but disrupted thermal coal supply chains struggled to catch up. COVID-19 restrictions, wet weather, mine accidents, licence disputes, rail underperformances, protests and strikes contributed to coal supply disruptions. In Europe, the price of coal, gas and LNG, as well as Europe-specific carbon prices, increased strongly for the better part of the year.
Iron ore prices traded at record levels on the back of strong Chinese steel production, supported by the rest of the world's robust demand conditions, before concerns around China's economy slowing, pollution-related steel output cuts and relatively low steel mill profitability, triggered a change in sentiment that led to significant price declines towards the end of 2021.
In terms of our capital allocation framework, free cash flow generated will be prioritised per the diagram below:
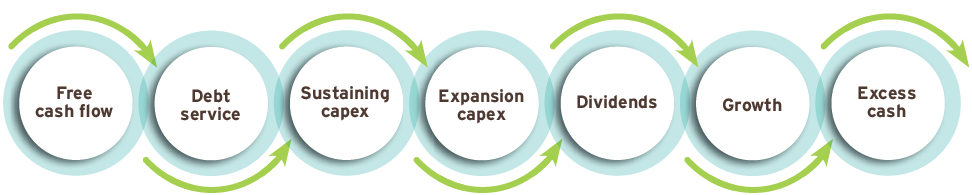
The diagram above represents the order of our capital allocation framework. In applying our capital allocation framework, we aim for a gearing ratio of below 1.5 times net debt (excluding ring-fenced project financing) to EBITDA. The capital allocation framework is in line with our commitment to sustainably returning cash to shareholders through the cycle while retaining a strong financial position.
During 2021, we received cash of R25 billion (2020: R10.1 billion), comprising R9.2 billion from our operations (net of tax paid) (2020: R6.8 billion), dividend income received from our equity-accounted investments of R10.0 billion (2020: R3.3 billion) and proceeds received from the disposal of our investment in Tronox Holdings plc of R5.8 billion.
In terms of our capital allocation framework, we utilised this cash to mainly:
At 31 December 2021, our net cash to EBITDA cover ratio was 0.1 (2020: net debt to EBITDA cover ratio 0.96), which is below our target of 1.5 times.
In April 2021, Exxaro successfully refinanced its R8 billion loan facility with various financial institutions, of which R3.25 billion remains undrawn.
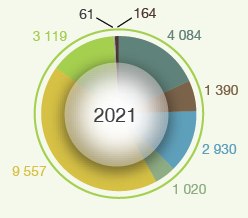
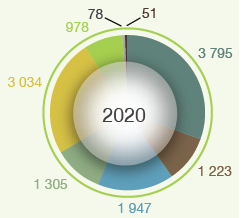
The value generated by Exxaro is distributed to its various stakeholders as follows:
Value distribution (Rm)
For a better understanding of the comparability of results between the two reporting periods, we have adjusted the financial results with non-core adjustments to derive our core financial results. The non-core adjustments in 2021 are the same as the headline earnings adjustments, resulting in no change between EBITDA and headline earnings to core EBITDA and core headline earnings, respectively. Further details on non-core items are shown under the respective financial performance measures.
Revenue (Rm)
EBITDA (Rm)
Equity income (Rm)
HEPS (Cents)
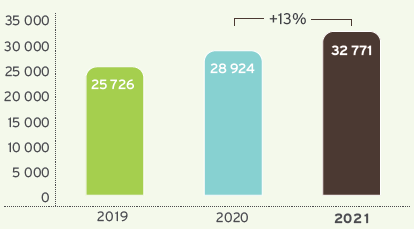
Group revenue increased 13% to R32 771 million (2020: R28 924 million), mainly due to the increase in coal revenue and the inclusion of renewable energy revenue from Cennergi for 12 months compared to nine months in 2020.
While coal production and export sales volumes were 10% and 9% lower respectively, a 91% increase in the average benchmark API4 export price to US$124 per tonne (2020: US$65 per tonne) more than offset the impact of the pandemic and logistical challenges experienced.
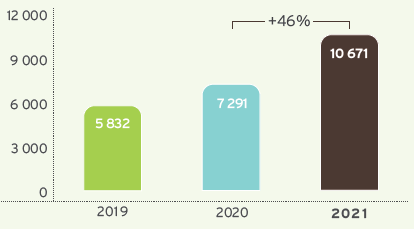
Group core EBITDA increased 46% to R10 671 million (2020: R7 291 million), mainly attributable to a 38% increase in coal core EBITDA (discussed in more detail under the coal business performance) and the inclusion of Cennergi results for 12 months compared to only nine months in 2020.
For a better understanding of the comparability of results between the two reporting periods, the table below sets out the non-core adjustments to derive our core EBITDA.
| Description | 2021 Rm |
2020 Rm |
| EBITDA | 10 671 | 7 246 |
|---|---|---|
| – Insurance claim recovery from external parties | (14) | |
| – Losses on financial instruments revaluations recycled to profit or loss on deemed disposal of Cennergi joint venture | 59 | |
| Core EBITDA | 10 671 | 7 291 |
Group core EBITDA increased 46% to R10 671 million (2020: R7 291 million) for reasons shown in the graph below.
Group core EBITDA – higher revenue and cost containment increase profitability (Rm)
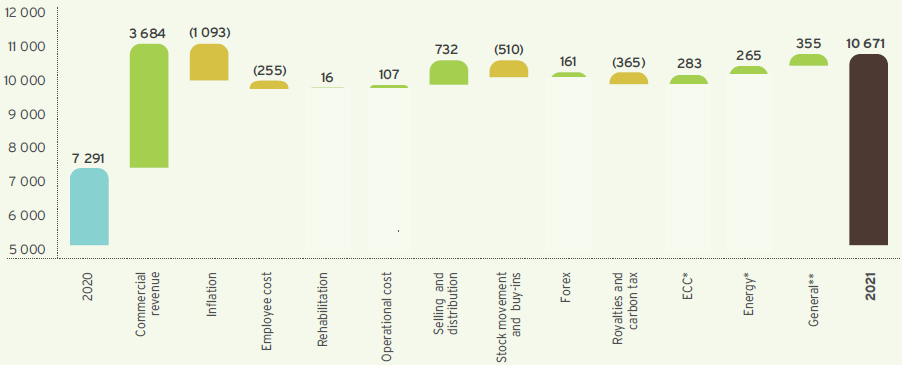
| * | ECC included for 12 months in 2020 compared to eight months in 2021. Energy included for nine months in 2020 compared to 12 months in 2021. |
| ** | Total EBITDA variance for Matla included in General ± R13 million. |
The positive revenue impact is discussed under group revenue.
Inflationary pressure on costs was driven by diesel and electricity tariff increases that were significantly higher than the PPI inflation rate. Employee cost was higher due to bonus payments in line with performance targets, as well as higher costs incurred on the ESOP scheme, which included the payment of a special dividend associated with the disposal of our shareholding in Tronox Holdings plc.
Operational costs decreased, in line with lower production volumes and cost saving initiatives, which were partially offset by lower buy-ins from our Mafube joint venture, but at higher prices. Selling and distribution costs are in line with lower export sales volumes. Lower production volumes resulted in higher inventory drawdowns from our stockpiles and some third party buy-ins to meet our contractual sales volumes.
The net positive forex variance is a combination of realised and unrealised forex differences on foreign debtors and cash balances attributable to the fluctuation in the rand/US dollar exchange rate.
Royalties expense increased in line with higher revenue as well as lower capital expenditure to offset against the revenue.
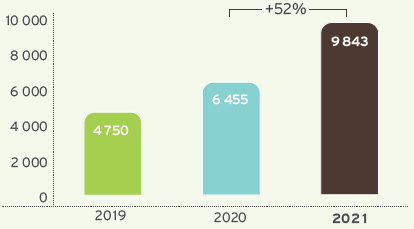
Core equity-accounted income from associates and joint ventures (after adjusting for non-core items) increased 52% to R9 843 million (2020: R6 455 million), mainly as a result of SIOC which benefited from a high iron ore price.
Refer to the table below for a full breakdown of core equity-accounted income.
| Core equity-accounted income/(loss) |
Dividends received | |||
| 2021 Rm |
2020 Rm |
2021 Rm |
2020 Rm |
|
| Coal: Mafube | 375 | 67 | ||
|---|---|---|---|---|
| Coal: Tumelo1 | 29 | |||
| Coal: RBCT | (18) | 8 | ||
| Energy: Cennergi2 | 13 | 144 | ||
| Energy: LightApp | 16 | (18) | ||
| Ferrous: SIOC | 9 035 | 6 123 | 9 991 | 3 119 |
| TiO2: Tronox SA3 | 54 | 226 | ||
| Other: Black Mountain | 352 | 122 | ||
| Other: Other4 | (86) | |||
| Total | 9 843 | 6 455 | 9 991 | 3 263 |
| 1 | Disposed on 3 September 2021 as part of the ECC operation. |
| 2 | Application of the equity method ceased on 31 March 2020 after which Cennergi was consolidated. |
| 3 | 2021 equity income up to the date of disposal on 24 February 2021. |
| 4 | Includes the investment in Insect Technology, which was fully impaired at 31 December 2020 and the investment in Curapipe, which was sold on 9 November 2020. |
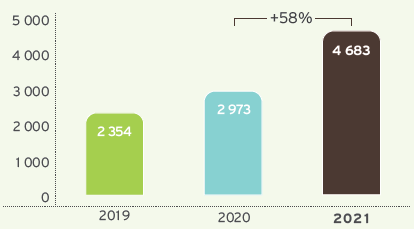
Headline earnings increased 56% to R11 568 million (2020: R7 417 million). The increase in headline earnings is mainly due to a 47% increase in group EBITDA and a 48% increase in equity-accounted income from SIOC, driven by high iron ore export prices and price premia. There was a slight decrease in the weighted average number of shares (WANOS) to 247 million (2020: 251 million) due to shares repurchased and cancelled in terms of the R1.5 billion share repurchase programme. The total number of shares repurchased was 9 401 662, representing 2.62% of Exxaro's issued share capital before the buyback.
The earnings increase and the change in WANOS equates to basic HEPS of 4 683 cents per share (2020: 2 955 cents per share).
| Description | 2021 Rm |
2020 Rm |
| Headline earnings | 11 568 | 7 417 |
|---|---|---|
| – EBITDA adjustments | 45 | |
| Core headline earnings | 11 568 | 7 462 |
| 2021 Rm |
2020 Rm |
|
| ASSETS | ||
| Non-current assets | 63 298 | 65 824 |
| Property, plant and equipment | 38 351 | 38 395 |
| Intangible assets | 2 927 | 3 095 |
| Right-of-use assets | 401 | 453 |
| Inventories | 145 | 128 |
| Equity-accounted investments | 17 322 | 20 006 |
| Financial assets | 3 237 | 2 141 |
| Deferred tax | 369 | 1 076 |
| Other assets | 546 | 530 |
| Current assets | 12 419 | 9 033 |
| Inventories | 1 606 | 1 821 |
| Financial assets | 311 | 169 |
| Trade and other receivables | 2 701 | 2 827 |
| Cash and cash equivalents | 7 042 | 3 196 |
| Other assets | 759 | 1 020 |
| Non-current assets held-for-sale | 3 749 | |
| Total assets | 75 717 | 78 606 |
| EQUITY AND LIABILITIES | ||
| Capital and other components of equity | ||
| Share capital | 983 | 1 021 |
| Other components of equity | 1 560 | 2 495 |
| Retained earnings | 37 007 | 35 265 |
| Equity attributable to owners of the parent | 39 550 | 38 781 |
| Non-controlling interests | 10 548 | 9 340 |
| Total equity | 50 098 | 48 121 |
| Non-current liabilities | 20 841 | 19 103 |
| Interest-bearing borrowings | 9 255 | 7 448 |
| Lease liabilities | 470 | 493 |
| Other payables | 53 | 24 |
| Provisions | 2 201 | 1 946 |
| Retirement employee obligations | 159 | 147 |
| Financial liabilities | 406 | 782 |
| Deferred tax | 8 271 | 8 236 |
| Other liabilities | 26 | 27 |
| Current liabilities | 4 778 | 10 244 |
| Interest-bearing borrowings | 1 000 | 6 163 |
| Lease liabilities | 34 | 29 |
| Trade and other payables | 2 230 | 2 940 |
| Provisions | 101 | 185 |
| Financial liabilities | 49 | |
| Overdraft | 1 | 17 |
| Other liabilities | 1 412 | 861 |
| Non-current liabilities held-for-sale | 1 138 | |
| Total liabilities | 25 619 | 30 485 |
| Total equity and liabilities | 75 717 | 78 606 |
Property, plant and equipment decreased by R44 million when compared to the corresponding period last year, which includes R1 635 million spend on sustaining and environmental capital (stay-in-business capital) and R836 million on expansion capital, offset by depreciation charges of R2 445 million. The net movement further included the disposal of the ECC* operation and borrowing costs capitalised.
Cash and cash equivalents increased 120% to R7 042 million when compared to the previous year. Cash flow generated by operations of R10 552 million (2020: R7 770 million) and dividends received from investments of R9 991 million (2020: R3 263 million) were sufficient to cover our capital expenditure and ordinary dividends paid.
* Divestment concluded in September 2021.
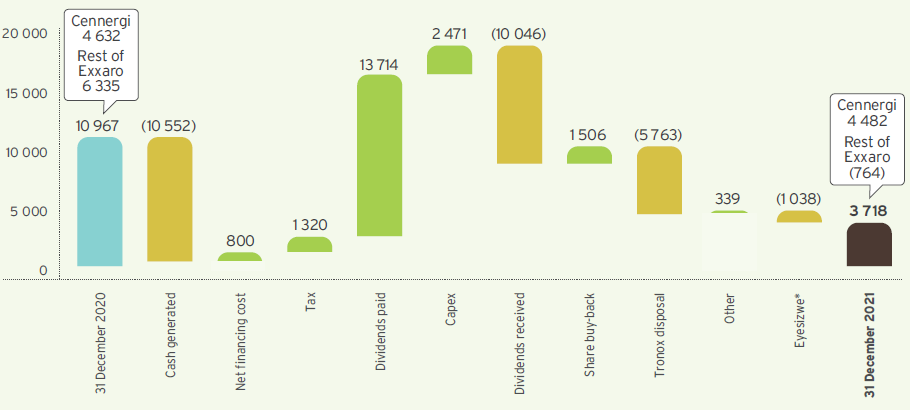
Our positive operational results and monetisation of our investment in Tronox Holdings plc strengthened our balance sheet, resulting in a net cash position of R764 million (excluding Cennergi's net debt of R4 482 million), compared to net debt of R6 335 million (excluding Cennergi's net debt of R4 632 million) at 31 December 2020.
The graph below summarises key movements in the net debt balance for the year ended 31 December 2021.
Group results – net debt 2021 (Rm)
Exxaro concluded its strategy to monetise its investment in Tronox Holdings plc when Tronox Holdings plc exercised the "flip-in" call option for the Tronox SA shares. This became effective on 24 February 2021 and resulted in the deemed disposal of the Tronox SA shares in exchange for Tronox Holdings plc ordinary shares. On 1 March 2021, all Tronox Holdings ordinary shares were sold.
On 8 April 2021, Exxaro signed a sale and purchase agreement to dispose of our ECC* operations to Overlooked Colliery. All conditions precedent to the sale and purchase agreement were fulfilled and the transaction became effective on 3 September 2021.
The disposal process for Leeuwpan continues with definitive legal agreements envisaged to be signed in the first half of 2022, and regulatory approvals obtained.
Exxaro continues to evaluate its options to dispose of its 26% shareholding in Black Mountain.
* Divestment concluded in September 2021.
The achievement of our key financial performance indicators is presented in the table below.
All internal KPIs are well within target, indicating a healthy balance sheet and strong cash flow generation. The impact of various coal sensitivity measures as well as the key financial risk factors can be further used to stress test our current headroom.
We have also comfortably met all our bank covenants for the year ended 31 December 2021 as well as the previous financial year.
| Performance – key indicators | Target | 2020 | 2021 |
| Internal KPIs | |||
| EBITDA interest cover* (times) | >4 | 15 | 75 |
| Net debt/(cash):equity* (%) | <40 | 17 | (2) |
| Net debt/(cash):EBITDA* (times) | <1.5 | 1.0 | (0.1) |
| ROCE (%) | >20 | 25 | 45 |
| Bank covenants** | |||
| Net debt/(cash):equity (%) | <80 | 14 | (1) |
| EBITDA interest cover (times) | >4 | 11 | 35 |
| Net debt:EBITDA (times) | <3 | 0.7 | 0.0 |
| * | Excluding Cennergi since consolidation of 100% of results since the step-up acquisition from 1 April 2020. |
| ** | Including dividends received from associates and contingent liabilities, except DMRE guarantees and excluding Cennergi consolidated results. |
The following diagram indicates certain sensitivities on the coal net operating profit.
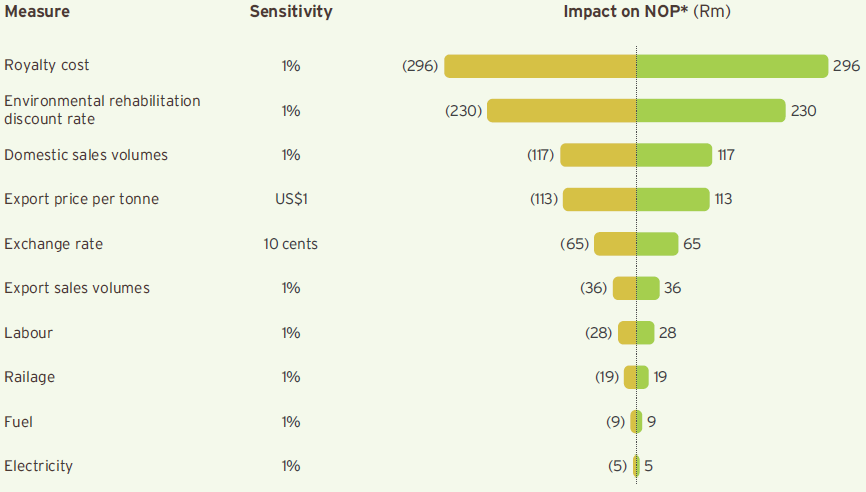
* Net operating profit.
The group's corporate treasury function predominantly provides financial risk management services to the business, coordinates access to domestic and international financial markets, and monitors and manages the financial risks relating to the operations of the group through internal risk reports which analyse exposure by degree and magnitude of risks. These include market risk (including foreign currency risk, commodity price risk, interest rate risk and price risk), credit risk and liquidity risk.
In managing its capital, the group focuses on a sound net debt position, return on shareholders' equity (or return on capital employed) and the level of dividends to shareholders. The group's policy is to cover its annual net funding requirements through long-term loan facilities with maturities spread over time. Neither the company nor any of its subsidiaries are subject to externally imposed capital requirements.
Market risk is the risk that changes in market prices, such as foreign exchange rates, interest rates, commodity prices and equity prices, will affect profit or the value of its holdings of financial instruments.
The objective of market risk management is to manage and control market risk exposure within acceptable parameters, while optimising the return on risk.
The group's activities expose it primarily to the financial risks of foreign currency exchange rates, commodity prices, interest rates and changes in the environmental rehabilitation funds' portfolio of assets' quoted prices.
The group's exposure to price risk in relation to quoted prices of the environmental rehabilitation funds is not considered a significant risk as the funds are invested with reputable financial institutions in accordance with a strict mandate to ensure capital preservation and growth. The funds are held for strategic purposes rather than trading purposes.
Certain transactions are denominated in foreign currencies, hence exposures to exchange rate fluctuations arise. The currency in which transactions are entered into is mainly denominated in US dollar, euro and Australian dollar. Exchange rate exposures are managed within approved policy parameters utilising foreign exchange contracts (FECs), currency options and currency swap agreements.
The group maintains a fully covered exchange rate position for foreign loans (if any) and imported capital equipment resulting in these exposures being fully converted to rand. Trade-related import exposures are managed using economic hedges arising from export revenue and through FECs. Trade-related export exposures are hedged using FECs and currency options with specific focus on short-term receivables.
Uncovered cash and cash equivalents amount to US$49.85 million (2020: US$116.35 million).
Monetary items have been translated at the closing rate at the last day of the reporting period.
The FECs used to hedge foreign currency exposure mostly have a maturity of less than one year from the reporting date. When necessary, FECs are rolled over at maturity.
| 2021 | 2020 | |||||
| Average spot rate |
Average achieved rate |
Closing spot rate |
Average spot rate |
Average achieved rate |
Closing spot rate |
|
| US$ | 14.78 | 14.88 | 15.94 | 16.45 | 16.43 | 14.62 |
|---|---|---|---|---|---|---|
| € | 17.47 | 18.04 | 18.76 | 17.97 | ||
| AU$ | 11.11 | 11.55 | 11.35 | 11.27 | ||
The group entered into commodity FECs to hedge certain of its export product exposure in terms of coal prices for the period ended 31 December 2020. The commodity price hedges on coal matured in April 2021, realising a total loss of R43 million. There were no commodity FECs at 31 December 2021.
The group is exposed to interest rate risk as it borrows and deposits funds at floating interest rates on the money market and extended bank borrowings. The group's main interest rate risk arises from long-term borrowings with floating rates, which expose the group to cash flow interest rate risk. The risk is managed by undertaking controlled management of the interest structures of the investments and borrowings, maintaining an appropriate mix between fixed and floating interest rate facilities in line with the interest rate expectations. The group also uses interest rate swaps and interest rate forwards to manage the interest rate risk exposure.
As part of the Cennergi business combination, the group assumed Cennergi's borrowings and interest rate swaps as financial liabilities in 2020. The contractual terms of these borrowings required interest rate swaps (hedging instruments) to be entered into to swap out the floating interest rate of the underlying project financing (hedged items) for a fixed interest rate. This was required to fix the future expected returns given the long-term nature of the project financing. The group amended its interest rate risk management strategy taking cognisance of the assumed Cennergi borrowings and interest rate swaps.
When the contractual terms of the borrowings and associated covenants require the use of hedging instruments to mitigate the risk of fluctuations of the underlying interest rate risk cash flow exposure and the impact on profit or loss of specific projects being financed, the group looks to apply hedge accounting where an effective hedge relationship is expected and to the extent that such exposure poses a real risk to the achievement of the loan covenants.
The financial institutions chosen are subject to compliance with the relevant regulatory bodies.
The loan facility and bonds were entered into at floating interest rates in anticipation of a decrease in the interest rate cycle.
The interest rate repricing profile for the loan facility and bonds is summarised below for Exxaro:
| 1 to 6 months Rm |
Total borrowings Rm |
|
| At 31 December 2021 | ||
| Non-current interest-bearing borrowings: loan facility and bond | 4 704 | 4 704 |
| Current interest-bearing borrowings: loan facility and bond | 851 | 851 |
| Total interest-bearing borrowings: loan facility and bond | 5 555 | 5 555 |
| Total borrowings (%) | 100 | 100 |
| At 31 December 2020 | ||
| Non-current interest-bearing borrowings: loan facility and bond | 2 748 | 2 748 |
| Current interest-bearing borrowings: loan facility and bond | 6 053 | 6 053 |
| Total interest-bearing borrowings: loan facility and bond | 8 801 | 8 801 |
| Total borrowings (%) | 100 | 100 |
The group is exposed to the risk of variability in future interest payments on the project financing, attributable to fluctuations in three-month JIBAR. The designated hedged item is the group of forecast floating interest rate cash flows arising from the project financing, up to the notional amount of each interest rate swap, over the term of the hedging relationship. The notional amounts per interest rate swap match up to the designated exposure being hedged.
Where all relevant criteria are met, hedge accounting is applied to remove the accounting mismatch between the hedging instrument and the hedged item. This will effectively result in recognising interest expense at a fixed interest rate for the hedged project financing.
The exposure profile is summarised as follows:
| Percentage exposure | ||||
| At 31 December | 2021 % |
2020 % |
2021 % |
2020 % |
| Project financing nominal amount | 100 | 100 | (4 700) | (4 810) |
|---|---|---|---|---|
| – Linked to fixed rate | 3 | 3 | (145) | (158) |
| – Linked to floating rate | 97 | 97 | (4 556) | (4 652) |
| Project financing nominal amount linked to floating rate | 97 | 97 | (4 556) | (4 652) |
| Interest rate swap notional amount (swap floating rate to fixed rate) | (81) | (81) | 3 808 | 3 885 |
| Effective floating rate exposure on project financing1 | 16 | 16 | (748) | (767) |
| Tsitsikamma SPV | (748) | (767) | ||
| 1 | Represents 40% exposure on the Tsitsikamma SPV project financing. |
Liquidity risk is the risk that the group will not be able to meet its financial obligations as they fall due. The group's approach to managing liquidity is to ensure, as far as possible, that it will always have sufficient liquidity to meet its liabilities when due, under normal and stressed conditions, without incurring unacceptable losses or risking damage to the group's reputation.
The ultimate responsibility for liquidity risk management rests with the board which has built an appropriate liquidity risk management framework for the group's short, medium and long-term funding and liquidity management requirements.
The group manages liquidity risk by monitoring forecast cash flows in compliance with loan covenants and ensuring that adequate unutilised borrowing facilities are maintained.
| 2021 Rm |
2020 Rm |
|
| Amount approved | 49 438 | 48 476 |
|---|---|---|
| Total borrowings | (10 255) | (13 611) |
| Unutilised borrowing capacity | 39 183 | 34 865 |
The group's capital base, the borrowing powers of the company and the group were set at 125% of shareholders' funds for both the 2021 and 2020 financial years.
To avoid incurring interest on late payments, financial risk management policies and procedures are entrenched to ensure the timeous matching of orders placed with goods received notes or services acceptances and invoices.
Credit risk relates to potential default by counterparties on cash and cash equivalents, loans, investments, trade receivables and other receivables.
The group limits its counterparty exposure arising from money market and derivative instruments by only dealing with well-established financial institutions of high credit standing. The group's exposure and credit ratings of its counterparties are continuously monitored, and the aggregate value of transactions concluded are spread among approved counterparties. Credit exposure is controlled by counterparty limits that are reviewed and approved by the audit committee annually.
Exxaro has concentration risk because of its exposure to one major customer. This is, however, not considered significant as the customer adheres to the stipulated payment terms.
Exxaro establishes an allowance for non-recoverability or impairment that represent its estimate of expected credit losses for trade receivables, other receivables, loans, cash and cash equivalents and investments. The main components of these allowances are a 12-month expected credit loss component that results from possible default events within the 12 months after the reporting date and a lifetime expected credit loss component that results from all possible default events over the expected life of a financial instrument.
The carrying amount of financial assets represents the maximum credit exposure. None of the financial assets below were held as collateral for any security provided.
| At 31 December | 2021 % |
2020 % |
| By geographical area | ||
| RSA | 88 | 72 |
| Europe | 8 | 16 |
| Asia | 12 | |
| USA | 4 | |
| Total | 100 | 100 |
| By industry | ||
| Public utilities | 67 | 57 |
| Mining | 5 | 6 |
| Manufacturing | 2 | 1 |
| Merchants | 15 | 30 |
| Food and beverage | 1 | 1 |
| Steel | 9 | 4 |
| Cement | 1 | |
| Other | 1 | |
| Total | 100 | 100 |
In the first half of 2022, the post-pandemic economic surge is expected to subside, as pent-up demand is exhausted, allowing for a downshift in global real GDP expansion. The withdrawal of fiscal and monetary policy stimuli will weigh on global growth as governments contain spending and contend with higher debt burdens. COVID-19 vaccination rates are expected to increase further, and barring any renewed infection rate increases, enabling affected economies to reopen.
The pandemic has strained South Africa's fiscal position, with public sector debt unsustainably high. Furthermore, South Africa experienced its worst-ever year of rotational power cuts, with Eskom continuing to highlight the impact of high debt burdens, illegal connections and weak cash flow. South Africa's electricity constraints are expected to continue into 2022 impacting growth prospects.
The rand/US dollar exchange rate is expected to remain volatile in the first half of 2022, depending on whether the surge in inflation largely reflects transitory factors.
Exxaro will also continue to closely monitor the impact of the Russian/Ukrainian conflict and how it will impact the global economy and supply chains.
The domestic unsized market will continue experiencing pressure due to the increased volumes in the domestic market on the back of lower rail performance as domestic mining operations continue to struggle to excavate coal destined for the export market. On the international front, we expect the demand for coal to remain strong as supply is constrained. The influence of high gas prices and expected cold weather in the northern hemisphere, as well as the Russian/Ukrainian conflict will continue to drive demand for our coal.
Lower steel production is anticipated in China, due to power shortages, a property sector slump, emission controls and a broad-based economic slowdown.
Global iron ore supply growth remains a further downside risk to the expected softer market, albeit that the Russian/Ukrainian conflict may cause supply disruption.
As previously communicated, poor logistical performance is impacting our ability to produce and export coal at desired levels. This highlighted the importance to respond quickly to value chain interruptions, and through our integrated operations centres and M2R optimisation strategy, we have the visibility required to respond effectively.
To remain competitive across various markets, our operational excellence and digital programmes are focused on specific projects across the value chain, aimed at managing stock levels, productivity and production costs.
The prefeasibility study to determine the way forward for the Moranbah South hard coking coal project started during the third quarter of 2021 and is expected to be completed by the first quarter of 2023.
Riaan Koppeschaar
FD
4 April 2022