Exxaro Resources Limited
Group and company annual financial statements for the year ended 31 December 2025
Group financial performance
Operational performance
Achieved 96% export coal price realisation of the average API4 price
Energy Operational wind assets EBITDA margin 79%
Macro-economic landscape
Since taking office in January 2025, US President Donald Trump implemented a series of tariffs and trade measures following multiple rounds of escalation and subsequent easing. These policy shifts reshaped global trade dynamics, weighing on international sentiment and contributing to heightened financial market volatility and the weakening of the US dollar. Despite these headwinds, overall global economic activity maintained positive momentum through 2025.
Coal markets and commodity price
In 2025, the thermal coal market faced lower seaborne demand, ongoing oversupply, and pricing pressure, with the API4 index falling below US$80 per tonne in October 2025. Weak import demand, especially from India, reflected slower industrial activity, stronger renewables, and ample domestic supply. In contrast, demand across Asia and Europe generally softened as gas, nuclear, and clean energy gained ground.
Domestically, coal demand remained stable, with resilience supported by premium coal demand and flexible redirection to local markets. In the Waterberg region, coal offtake from Grootegeluk remained subdued due to operational constraints at the Matimba power station. This was partially offset by the successful return of Unit 4 at the Medupi power station.
Coal logistics and infrastructure
Despite some setbacks in the first half of 2025, including a rail wash-away affecting Grootegeluk and two derailments that further impacted throughput, TFR achieved an improved annual performance of 9.5%, ending the year at 56.82Mt, compared to 51.91Mt in 2024.
Coal line performance gains were particularly evident in the Mpumalanga region, where operational stability improved considerably. However, performance in the Waterberg region did not experience a similar uplift and continues to operate below capacity.
To address these constraints and support sustained growth, TFR and the coal industry have agreed on a series of initiatives to be implemented, focused on stabilising operations and increasing throughput. Operational efficiency remains central to our financial resilience and long-term value creation.
Energy market environment
South Africa accelerated its renewable energy transition in 2025 through firm policy execution and market reform. Cabinet approved the South African Renewable Energy Masterplan (SAREM), targeting 3GW to 5GW of new renewable capacity annually by 2030, while the Integrated Resource Plan (IRP 2025) outlines large-scale capacity expansion through to 2039. Private sector offtake remains the primary driver of new generation despite regulatory and grid constraints.
To address grid-access limitations, the National Energy Regulator of South Africa (NERSA) approved a temporary congestion curtailment mechanism (1 April 2025 to 31 March 2028), unlocking ~3.4GW of wind capacity.
Transmission expansion progressed via the Independent Transmission Programme (ITP), with seven consortia selected to develop 1 164km of new 400kV lines across key provinces. Market reforms also advanced with preparations for the South African Wholesale Electricity Market (SAWEM). These developments support Exxaro’s low-carbon growth opportunities.
Group business and financial performance
Revised segmental reporting
In line with the changes to the executive leadership team and organisational structure, and in anticipation of the completion of the select manganese assets acquisition, the segmental disclosures have been re-presented, notably, to incorporate a metals reportable segment.
The adjustments to the segmental information are as follows:
Group revenue and EBITDA
|
Revenue |
EBITDA1 |
|||||||
|---|---|---|---|---|---|---|---|---|
|
2025 Rm |
(Re- presented)2 2024 Rm |
% change |
2025 Rm |
(Re- presented)2 2024 Rm |
% change |
|||
|
Coal |
40 109 |
39 115 |
3 |
10 251 |
10 236 |
|||
|
Energy |
1 410 |
1 411 |
859 |
1 031 |
(17) |
|||
|
Metals |
(178) |
|||||||
|
Other3 |
252 |
199 |
27 |
(707) |
(844) |
16 |
||
|
Total |
41 771 |
40 725 |
3 |
10 225 |
10 423 |
(2) |
||
1 Refer note 3.3 for key numbers used in the calculation of EBITDA.
2 Re-presented to include the FerroAlloys financial results up to the date of disposal (31 October 2025) in the other segment.
3 Relates mainly to the corporate office, smaller operations and FerroAlloys.
In 2025, Exxaro delivered a strong performance, driven by operational, cost and marketing efficiencies, despite facing a challenging macro-economic environment.
Group revenue increased to R41 771 million (2024: R40 725 million), mainly driven by a 3% rise in coal revenue.
Group EBITDA declined marginally, by 2% to R10 225 million (2024: R10 423 million), resulting in an EBITDA margin of 24%, compared with 26% in 2024. Although our coal EBITDA increased by R15 million to R10 251 million (2024: R10 236 million), this was offset by a 17% decline in energy EBITDA to R859 million (2024: R1 031 million). In addition to the lower generation, the energy business incurred growth-associated costs linked to our strategic acquisition initiatives and to strengthening internal capabilities. The Operational EBITDA margin remains consistent year on year.
The metals segment’s negative EBITDA comprises costs associated with the acquisition of the select manganese assets, with a negative contribution from the other operating segment of R707 million (2024: R844 million). Further details are provided in the segmental performance discussions.
Equity-accounted income
|
Equity-accounted income/(loss) |
Dividends received |
|||||||
|---|---|---|---|---|---|---|---|---|
|
2025 Rm |
2024 Rm |
% change |
2025 Rm |
2024 Rm |
% change |
|||
|
Coal: Mafube |
66 |
234 |
(72) |
100 |
130 |
(23) |
||
|
Coal: RBCT |
(21) |
(7) |
<100 |
|||||
|
Metals: SIOC |
3 954 |
3 979 |
(1) |
3 267 |
3 741 |
(13) |
||
|
Metals: Black Mountain |
489 |
64 |
>100 |
|||||
|
Total |
4 488 |
4 270 |
5 |
3 367 |
3 871 |
(13) |
||
Income from equity-accounted investments increased to R4 488 million (2024: R4 270 million), mainly driven by:
These investments continue to provide Exxaro with meaningful diversification and enhanced earnings quality.
Earnings
Headline earnings increased 6% to R7 728 million (2024: R7 298 million), primarily driven by the increase in equity-accounted income.
WANOS decreased to 238 million (2024: 242 million) due to the repurchase and cancellation of shares under the share repurchase programme. A total of 7 391 418 shares were repurchased, representing 2.1% of Exxaro’s issued share capital before the repurchase.
The earnings increase and the change in WANOS equate to HEPS of 3 247 cents per share (2024: 3 016 cents per share), an increase of 8%.
Cash flow, capital expenditure and balance sheet
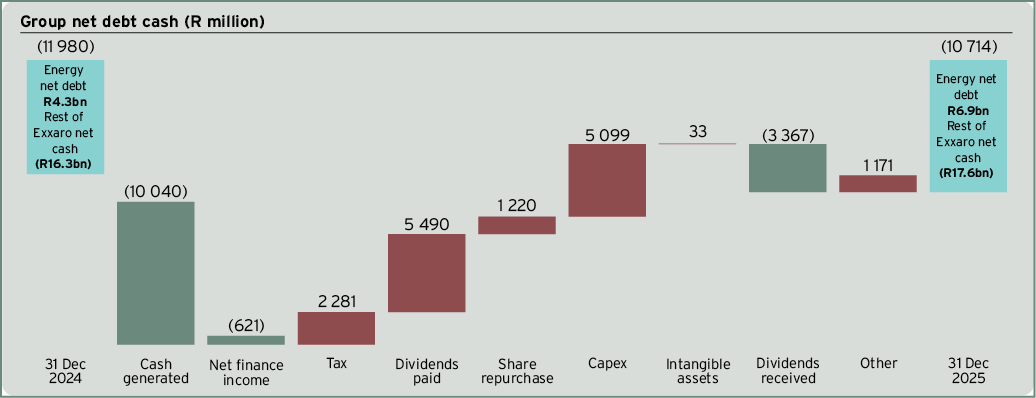
Exxaro’s portfolio of high-quality, well-capitalised assets, supported by disciplined operational execution and effective working capital management, continues to deliver strong and consistent cash generation of R10 040 million (2024: R10 432 million). Dividends received from equity-accounted investments amounted to R3 367 million (2024: R3 871 million), primarily from SIOC. These cash flows were sufficient to fund capital expenditure, taxation, and ordinary dividends paid.
Total capex increased to R5 099 million (2024: R2 448 million), comprising:
Our balance sheet remains strong and flexible, underpinned by robust cash generation and prudent capital allocation. Strong operational cash generation increased the group’s net cash position (excluding energy’s net debt) to R17 641 million as at 31 December 2025 (31 December 2024: R16 309 million). Energy’s net debt amounted to R6 927 million (31 December 2024: R4 329 million), with limited recourse to Exxaro’s balance sheet and hedged through interest rate swaps.
|
|
|---|
Coal operational and business performance
Coal revenue and EBITDA
|
Revenue |
EBITDA1 |
|||||||
|---|---|---|---|---|---|---|---|---|
|
2025 Rm |
2024 Rm |
% change |
2025 Rm |
2024 Rm |
% change |
|||
|
Commercial – Waterberg |
23 703 |
22 563 |
5 |
10 314 |
10 116 |
2 |
||
|
Commercial – Mpumalanga |
8 384 |
9 893 |
(15) |
(11) |
246 |
(>100) |
||
|
Tied1 |
8 022 |
6 659 |
20 |
191 |
175 |
9 |
||
|
Other |
(243) |
(301) |
19 |
|||||
|
Coal |
40 109 |
39 115 |
3 |
10 251 |
10 236 |
|||
1 Matla mine is supplying its entire production to Eskom.
Coal revenue increased to R40 109 million (2024: R39 115 million), mainly driven by higher sales volumes to Eskom from Matla. This was partly offset by lower demand from AMSA and by reduced export prices amid a stronger Rand to US dollar exchange rate. Our realised average export price decreased by 14% to US$86 per tonne (2024: US$100 per tonne).
Coal EBITDA increased marginally to R10 251 million (2024: R10 236 million), reflecting a consistent operating margin of 26% (2024: 26%). This was mainly driven by:
This increase was partly offset by:
Coal operational costs
In line with our disciplined approach to cost management, we continue to implement targeted initiatives to mitigate cost pressures and protect margins. Coal cash cost per tonne increased 2% to R653 per tonne (2024: R638 per tonne). In absolute terms, we successfully absorbed inflationary pressures by delivering on our improvement and efficiency projects, with coal production cash costs remaining largely flat at R20.5 billion (2024: R20.4 billion).
Coal capital projects
|
2025 Rm |
2024 Rm |
% change |
||
|---|---|---|---|---|
|
Sustaining |
||||
|
Commercial – Waterberg |
1 843 |
1 812 |
2 |
|
|
Commercial – Mpumalanga |
423 |
268 |
58 |
|
|
Total coal capex |
2 266 |
2 080 |
9 |
Sustaining capex in the coal business increased by R186 million (9%) in 2025, as a result of the capitalisation of the double benching mining at Belfast.
Energy operational and business performance
Cennergi’s assets generated 703GWh of electricity in 2025 (2024: 725GWh). Although the average plant availability of 98% exceeded the contracted levels of 97%, wind conditions were weaker than in the prior year. As a result, revenue remained largely unchanged at R1 410 million (2024: R1 411 million).
Despite lower electricity generation, Operational EBITDA margins on the operating wind assets remained robust at 79% (2024: 80%), supported by the long-term offtake agreements with Eskom, contributing to energy EBITDA of R859 million (2024: R1 031 million).
The 68MW Lephalale solar plant construction was materially completed in November 2025, with commissioning in December 2025. The plant achieved full-capacity operation in late December 2025 and commenced supplying green electricity to Grootegeluk, supplying 4GWh. The remaining steps to commercial operation primarily involve completing grid code compliance testing and associated regulatory processes, both of which are underway. Full commercial operation is expected in the first half of 2026, while the facility continues to supply green electricity at design capacity to Grootegeluk.
Construction on the 140MW Karreebosch project is advancing with commercial operation expected in the first half of 2027.
The project financing for Cennergi’s operating wind assets of R3 724 million (2024: R4 073 million) will be fully settled by 2031. Cumulative project financing for LSP SPV and Karreebosch SPV amounts to R3 967 million (2024: R1 150 million) and will be fully settled between 2042 and 2046. These facilities have limited recourse to the Exxaro balance sheet and are hedged through interest rate swaps.
Metals operational and business performance
Manganese operational cost
The negative EBITDA contribution of R178 million reported for the manganese business relates mainly to transaction costs incurred in connection with the acquisition of the select manganese assets.
Iron ore equity-accounted investment
Equity-accounted income from SIOC in 2025 decreased to R3 954 million (2024: R3 979 million), mainly due to the impairment reversal included in the 2024 results. Operational performance, however, increased year on year due to higher realised iron ore prices and improved operational stability across the value chain.
In July 2025, Exxaro received an interim dividend of R1 535 million from SIOC. In February 2026, SIOC declared a final dividend of R1 344 million to Exxaro, which will be accounted for in the first half of 2026.
Base metals equity-accounted investment
The equity-accounted income from Black Mountain increased to R489 million (2024: R64 million). The increase was driven by higher zinc production and sales volumes resulting from more favourable mining conditions, partially offset by lower commodity prices relative to 2024.
Other business performance
The other segment was re-presented to include FerroAlloys’ financial results up to the disposal date of 31 October 2025. The other segment primarily includes costs associated with the corporate office and smaller operations. It incurred lower EBITDA losses of R137 million compared to the prior year EBITDA loss of R844 million, mainly due to a positive contribution of R77 million from the FerroAlloys operation for the 10-month period, as well as more favourable fair value adjustments on our financial assets portfolio.
Dividend policy and final dividend
Exxaro remains committed to a disciplined approach in determining dividend payouts. In assessing the appropriate dividend cover, we consider prevailing industry conditions, capital expenditure requirements, and other strategic commitments, which is especially prudent given the current economic challenges, including the ongoing impact of logistical constraints, lower commodity prices, and a stronger Rand to US dollar exchange rate.
In line with our revised dividend policy, based on a pass-through of our SIOC dividend and a payout of between 1.5 times and 2.5 times Adjusted Group Earnings, the board has declared a final cash dividend of 1 000 cents per share comprising:
Further details of the final dividend are provided in note 5.5.