Exxaro Resource limited Report Selector 2018
Currently viewing Integrated Report 2018
Currently viewing Integrated Report 2018

Exxaro Resources Limited Integrated report 2018
Exxaro uses the six-capitals model (natural, human, social, manufactured, intellectual and financial capital) as a balanced approach to increase our potential to invest and develop for sustainable growth.
We strive to add value to the capitals during the lifecycle of every mining operation - with the aim of leaving each area richer after mine closure. At each stage of the value chain, which we refer to as the resource-to-market business model, the cumulative net effect is to leave a positive impact. Each sustainability capital that we affect will be responsibly managed to maximise the benefit to all stakeholders, internally and externally. This is detailed in the business model.
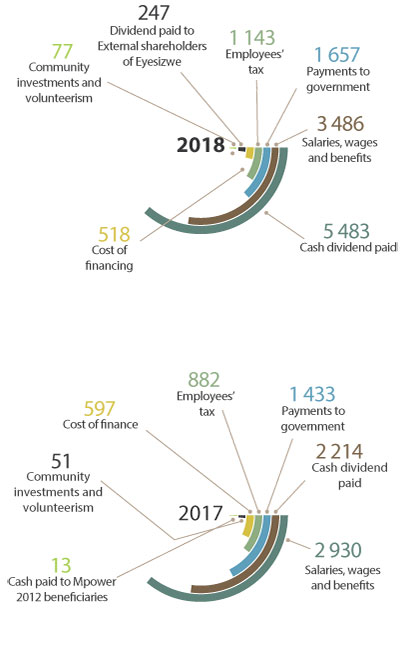
How we use and replenish our capitals ultimately translates into our financial capital - the primary purpose of any business. Adding value to each capital or managing the trade-offs supports our licence to operate (business model). The cash value-added statement shows the wealth the group has created through mining operations and investing activities:
Our employees enjoy the largest share of value created through earnings as well as self-development, which will continue to benefit the business R3.5 billion |
Shareholders receive a return on their investment through dividends and capital growth in the share price dividend 2 340cps |
||
Suppliers and contractors are supported by procuring consumables, services and capital goods R4.6 billion total spend, 34% from black suppliers* |
Governments of countries where we operate and invest receive various taxes and royalty payments R1.7 billion |
||
Providers of finance receive a return on their ROCE 23% |
Communities benefit from our investment in projects, including education programmes and infrastructure development R77 million |
||
| We are reinvesting in the growth of our coal business. A R15 billion expansion programme is under way in the
Waterberg and Mpumalanga regions R2.9 billion spent in FY18 |
|||
*Black-owned, black woman-owned, black emerging enterprises and black qualifying small enterprises.
Despite another challenging environment in 2018, we created significant value for our stakeholders and contributed meaningfully to the South African economy.
|
Performance against our sustainability capitals
1EBITDA is calculated by adjusting earnings before interest and tax for depreciation, amortisation, impairment charges and net loss or gain on disposal of
investments and assets.
|