Risks and opportunities
Exxaro is fully committed to effective risk management in pursuit of our strategic objective to create shareholder value. The group has a mature risk management culture that forms part of our strategy, governance and day-to-day operations.
Risk management process
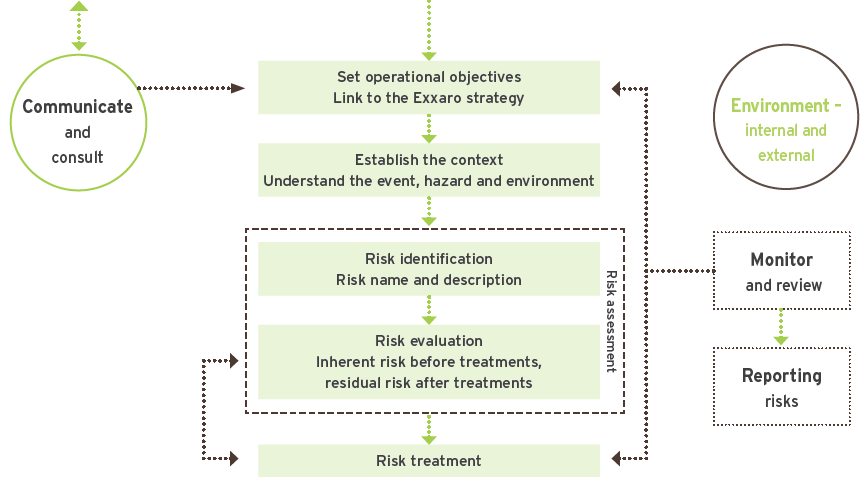
The Exxaro risk management process is a strategic enabler and embedded in all our processes, functions and systems. Risk management is ingrained in the Exxaro culture. The board and respective management layers consider business risks when setting strategies and monitor controls continuously at strategic, tactical and operational levels.
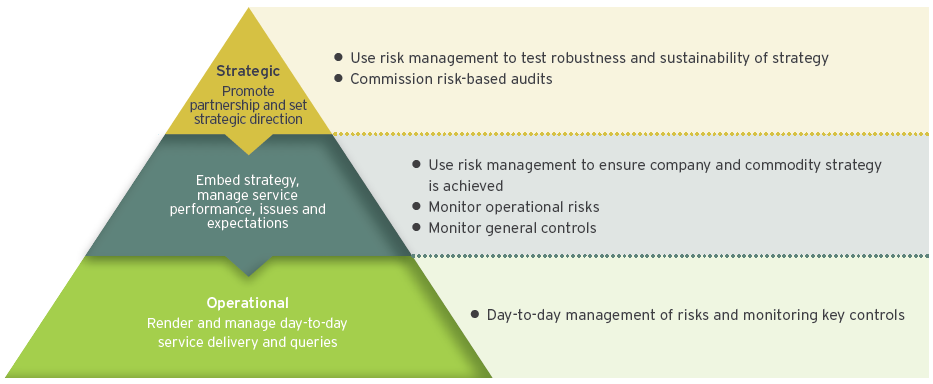
Layered approach
| Set the Exxaro strategy and objectives |
|
Risk management is performed at each layer with a different scope in mind. Each layer informs the next and is used as input to the specific risk profiles.
Pursuing opportunities
The Exxaro risk management framework also caters for the identification and realisation of opportunities in the organisation. We believe that for Exxaro to remain sustainable in the near future it is important to adapt to change and identify and pursue possible opportunities to ultimately create value for our shareholders.
The following opportunities have been identified as part of the business of tomorrow strategy (opportunities beyond the mining sector):
|
|
|
|
Opportunity |
|
|
Strategy |
|
|
|
|
|
|
| |
| 1 |
|
|
Micro grids |
|
|
Energy: distributed energy generation |
|
|
| |
|
| |
| 2 |
|
|
Optimising electricity use through analytics |
|
|
Energy: energy analytics |
|
|
| |
|
| |
| 3 |
|
|
Open facilitated energy trading |
|
|
Energy: energy exchange |
|
|
| |
|
| |
| 4 |
|
|
Insect protein from bio waste |
|
|
Agriculture: alternative agricultural products |
|
|
| |
|
| |
| 5 |
|
|
Farming at the retailer/small-farming aggregation |
|
|
Agriculture: bring farmers closer to market |
|
|
| |
|
| |
| 6 |
|
|
Innovative water leak repair |
|
|
Water: water saving |
|
|
| |
|
| |
| 7 |
|
|
Leak detection and pressure monitoring |
|
|
Water: water saving |
Risk appetite and thresholds
Exxaro defines risk appetite as the tendency of a group to take risks in a given situation and risk thresholds are used to express our appetite. We understand that if we really want to create value for all our stakeholders and remain sustainable, we need to measure and report on our key performance indicators.
The board and executive committee monitor KPIs quarterly to ensure all risks and key metrics are within Exxaro's risk appetite. The KPIs and their thresholds are reviewed by the board and executive committee at least annually.
2017 vs 2018 risk comparison
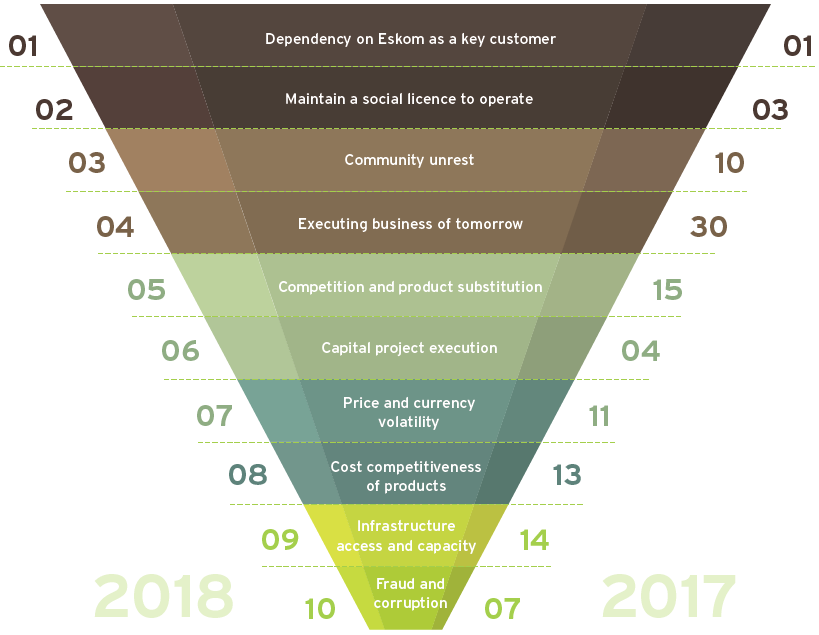
The trend report ranks risks from highest to lowest residual risk rating and compares FY17 with FY18. The residual score is the risk remaining after considering the existence and effectiveness of controls in place. Below we show the trend of Exxaro's top ten risks for FY18, ranked by residual risk rating:
|
Rank |
|
|
Risk |
|
|
2017 residual risk rating |
|
|
Trend |
|
|
2018 residual risk rating |
|
|
Comment |
|
|
|
|
|
|
|
|
|
|
|
|
|
|
|
| |
|
|
|
|
|
|
|
|
|
|
|
|
|
|
|
| |
|
|
| |
|
| |
|
| |
|
| |
|
| |
|
1 |
|
|
Dependency on Eskom as a key customer |
|
|
76 |
|
|  |
|
|
58 |
|
|
Risk rating reduced due to removal of AMSA, favourable arbitration rulings, and improved relationship with Eskom management |
|
2 |
|
|
Maintain a social licence to operate |
|
|
49 |
|
|  |
|
|
51 |
|
|
More clarity on mining charter offset by increased compliance requirements |
|
3 |
|
|
Community unrest |
|
|
38 |
|
| |
|
|
49 |
|
|
Risk rating increased on growing community dissatisfaction with employment, enterprise development, human resources development and supplier development |
|
4 |
|
|
Executing business of tomorrow |
|
|
17 |
|
| |
|
|
47 |
|
|
Critical that growth is realised against required investment criteria given global views on thermal coal |
|
5 |
|
|
Competition and product substitution |
|
|
36 |
|
| |
|
|
40 |
|
|
Risk rating marginally higher due to increased debate on thermal coal future |
|
6 |
|
|
Capital project execution |
|
|
48 |
|
| |
|
|
39 |
|
|
Progressive derisking of mega projects |
|
7 |
|
|
Price and currency volatility |
|
|
36 |
|
| |
|
|
39 |
|
|
Increased volatility in prices and exchange rate amid global trade wars and other geopolitical developments globally |
|
8 |
|
|
Cost competitiveness of products |
|
|
34 |
|
| |
|
|
38 |
|
|
Need to realise portfolio optimisation and benefits of business excellence and digitalisation |
|
9 |
|
|
Infrastructure access and capacity |
|
|
34 |
|
| |
|
|
35 |
|
|
Strategy to increase exports depends on access to allocation of logistical infrastructure |
|
10 |
|
|
Fraud and corruption |
|
|
40 |
|
| |
|
|
34 |
|
|
Lower after implementing anti-bribery and anti-corruption initiatives |
 |
Residual risk score increased |
|
 |
Residual risk score reduced |
|
 |
Residual risk score unchanged |
|
 |
New risk identified |
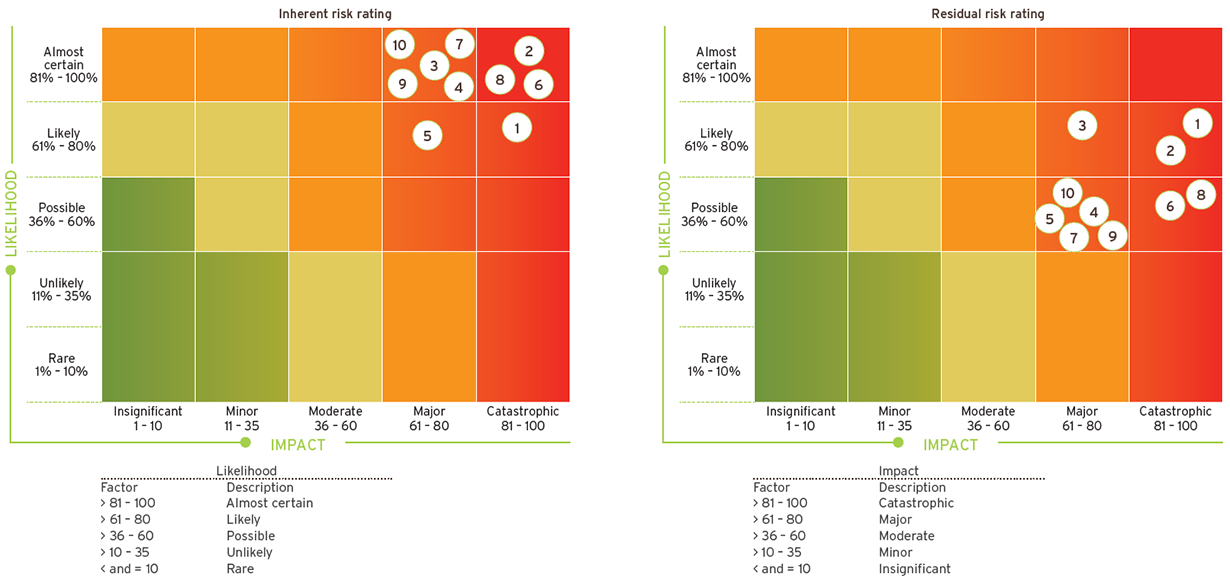
Top ten heat map distribution
The top ten risks are plotted on the heat map below, followed by an outline of Exxaro's key identified risks, the main drivers, their potential impacts and mitigating treatments. We have considered both internal and external risks, and our mitigation strategies depend on the severity of impact and likelihood of occurrence.
| 1 |
DEPENDENCY ON ESKOM AS KEY CUSTOMER |
|
|
KPIs: Production cost/tonne, export volume increase |
|
|
Lines of defence: None |
|
|
|
|
|
|
|
| |
|
|
| |
|
|
| |
|
Main drivers |
| |
Impacts |
|
|
Treatments |
- Eskom Medupi power station delays
- Inadequate funding of tied mines' rehabilitation liabilities
- Realisation of approved funding for capital requirements
- Non-payment of management fee at Arnot
- Eskom calling for over 25Mt at Grootegeluk in next five years for Medupi and Matimba
|
|
|
- Safety compromised since capital approvals for safety initiatives rest with Eskom
- Eskom's cash-flow constraints mean that Exxaro may not be paid or is paid late
- Operational constraints at Grootegeluk due to pit-liberation impacts from further Medupi delays
- Breakdown of relationships with unions and employees, and communities
- Inadequate funding for closure rehabilitation in trust fund for Arnot and Matla
|
|
|
- Broadening local and international customer base
- Build adequate stockpiles and mine bench 13 to supplement while GG6 Phase 2 is being built
- Enforcing coal-supply agreement and arbitration award on environmental funding
- Ongoing discussions on the future of Matla
- Top management engagement
|
|
|
|
| |
|
| |
|
|
|
|
|
|
|
| |
|
|
|
|
|
|
|
| |
|
|
|
|
|
|
|
| |
| 2 |
MAINTAIN SOCIAL LICENCE TO OPERATE |
|
|
KPIs: New mining charter and BBBEE dti elements |
|
|
Lines of defence: 3 |
|
|
|
|
|
|
|
|
|
|
|
| |
|
|
| |
| Main drivers |
| |
Impacts |
|
| Treatments |
- Unable to achieve social and labour plan (SLP) targets as
approved
- Increased social activism due to socio-economic challenges
- Increased state intervention in the mining sector through
legislation and regulation
- Depressed economic outlook
- Unable to meet some new mining charter targets,
eg procurement
- Onerous compliance requirements
|
|
|
- Adverse media exposure, affecting reputation
- Community unrest
- Production stoppages/closure by community
- Suspension/cancellation of mining right
- Financial losses
- Directives issued by DMR to remedy
- Penalties and fines for non-compliance
|
|
|
- Adherence as a minimum to new mining charter and BBBEE dti requirements
- Conduct SLP audits
- Proactive involvement in sustainable socio economic development initiatives
- Pursue identified initiatives to progressively improve Exxaro’s BBBEE rating
- Regular engagement with government
- Reporting on mining charter requirements (external and internal)
- Reporting on SLP requirements (external and internal)
|
|
|
|
| |
|
| |
|
|
|
|
|
|
|
|
|
|
|
|
|
|
|
|
|
|
|
|
|
|
|
|
|
|
|
| 3 |
COMMUNITY UNREST |
|
|
KPIs: Stakeholder survey, incident reporting |
|
|
Lines of defence: None |
|
|
|
|
|
|
|
|
|
|
|
| |
|
|
| |
| Main drivers |
| |
Impacts |
|
| Treatments |
- Dissatisfaction with local economic development initiatives
- Political manoeuvring
- Labour unrest that spreads to the community
- High unemployment rate
- Lack of service delivery by local government
- High demand for skills development/employment
|
|
|
- Potential harm to mine employees
- Potential damage to mine equipment
- Disruption to operations
- Reputational damage from adverse media
|
|
|
- Build local and national political relationships
- Emergency response and crisis-management plans
- Invest in non-mining skills development programmes
- Negotiations with community
- Ongoing employee engagement initiative
- Ongoing investment in community and communicating achievements
- Transparent and ongoing communication with stakeholders
|
|
|
|
| |
|
| |
|
|
|
|
|
|
|
|
|
|
|
|
|
|
|
|
|
|
|
|
|
|
|
|
|
|
|
| 4 |
EXECUTING BUSINESS OF TOMORROW |
|
|
KPI: Strength of project/initiative pipeline |
|
|
Lines of defence: 1, 2 |
|
|
|
|
|
|
|
|
|
|
|
| |
|
|
| |
| Main drivers |
| |
Impacts |
|
| Treatments |
- Shortage of ideas that match business-of-tomorrow criteria
- Not agile enough to capture suitable available initiatives or markets change rapidly
- Investors dissatisfied with non-mining growth and risk profile of business of tomorrow
- Skills and experience to operate as venture capitalists
|
|
|
- Financial loss
- Negative perception of business of tomorrow/reputational damage
- Not able to achieve objectives and board mandate
|
|
|
- Aim for a balanced portfolio of ideas
- Appoint and engage private equity-type skills
- Articulate criteria to ensure ideas adhere to these
- Communicate business-of-tomorrow strategy to investors to create awareness of this drive
- Continuously engage with decision makers on decision-making process/criteria
- Ensure internal understanding and acceptance of business of tomorrow
- Establish relations and alliances with funds, institutions in the futuristic space
- Portfolio approach to the programme
- Rigorous development and stage-gate process to approve and execute ideas
- Separate business of tomorrow from existing procedures and processes
- Take lessons from other companies and introduce in policies and procedures
- Comprehensive due-diligence process
|
|
|
|
| |
|
| |
|
|
|
|
|
|
|
|
|
|
|
|
|
|
|
|
|
|
|
|
|
|
|
|
|
|
|
| 5 |
COMPETITION AND PRODUCT SUBSTITUTION |
|
|
KPI — None |
|
|
Lines of defence: None |
|
|
|
|
|
|
|
|
|
|
|
| |
|
|
| |
| Main drivers |
| |
Impacts |
|
| Treatments |
- Regulatory push
- Price-driven substitution
- Advances in technology
- Pressure by stakeholders
- Environmental concerns
- Uncertainty of energy mix in SA
- Inability to grow coal and future material businesses
|
|
|
- Financial loss
- Reputational damage
- Loss of local business/Loss of investor confidence
|
|
|
- Early alerts on regulatory changes
- Implement diversification strategy
- Invest in cleaner coal-extraction alternatives
- Proactively engage with stakeholders
- Target selective markets where coal consumption is dominant and growing
|
|
|
|
| |
|
| |
|
|
|
|
|
|
|
|
|
|
|
|
|
|
|
|
|
|
|
|
|
|
|
|
|
|
|
| 6 |
CAPITAL PROJECT EXECUTION |
|
|
KPI: Project delivery measure for large/mega projects (time and cost) |
|
|
Lines of defence: 1, 2 and 3 |
|
|
|
|
|
|
|
|
|
|
|
| |
|
|
| |
| Main drivers |
| |
Impacts |
|
| Treatments |
- Challenges in project economic forecasting
- Programme delivery inconsistencies
- Poor cost and schedule control
- Poor programme and contractor implementation strategy
- Lack of access to strategic infrastructure (roads/water/housing, etc)
- Poor handover and production ramp-up
- Supply-chain management inefficiencies and poor contracting strategy
- SHEC and stakeholder management (community unrest) issues
- Poor interface management between contractors
- Ineffective change-control plan
- Ineffective quality-control programme
- Front-end loading not done with due diligence
- Legal and regulatory non-compliance
- Poor engineering and ongoing scoping changes
- Wrong contracting strategy
- Poor risk management process (risk profile)
- Tighter constraints on capital
- Contractor skills and experience mismatch
|
|
|
- Project delays
- Cost overruns
- Reputational damage
- Community unrest (business and job opportunities)
|
|
|
- Asset portfolio review and management
- Disciplined execution of value-engineering study review
- Encourage a culture to report both successes and failures (lessons learnt)
- Ensure project and supply chain performance is monitored and managed
- Ensure all project members understand value drivers and impacts
- Establish a contingency plan (plan B)
- Establish a robust governance structure
- Implement advanced assurance frameworks (independent review and oversight)
- Implement effective risk management process
- Improve capex forecast accuracy
- Monitor and track progress of capital projects
- Project role clarification and accountability
- Secure contractor's commitment to assigning a strong and experienced management team
- Standardise design and construction methodologies
|
|
|
|
| |
|
| |
|
|
|
|
|
|
|
|
|
|
|
|
|
|
|
|
|
|
|
|
|
|
|
|
|
|
|
| 7 |
PRICE AND CURRENCY VOLATILITY |
|
|
KPI — Various financial metrics |
|
|
Lines of defence: None |
|
|
|
|
|
|
|
|
|
|
|
| |
|
|
| |
| Main drivers |
| |
Impacts |
|
| Treatments |
- Unpredictable market conditions
- Global economic slowdown
- Questions about demand in China
- Social and political challenges in SA
- Geopolitical uncertainty, locally and globally
- Structural economic challenges in the US
- Depressed local demand
|
|
|
- Financial losses
- Difficult to forecast planning and budgets
|
|
|
- Hedging capital commitments
- Impact of volatility frequently assessed in corporate model
- Improve the speed of mine planning to match price volatility
- Negotiate long-term fixed-price contracts linked to currency
|
|
|
|
| |
|
| |
|
|
|
|
|
|
|
|
|
|
|
|
|
|
|
|
|
|
|
|
|
|
|
|
|
|
|
| 8 |
COST COMPETITIVENESS OF PRODUCTS |
|
|
KPI: Cost per tonne on cost curve |
|
|
Lines of defence: 2 |
|
|
|
|
|
|
|
|
|
|
|
| |
|
|
| |
| Main drivers |
| |
Impacts |
|
| Treatments |
- Inaccurate financial modelling
- Limited life of mine
- Poor capital project execution
- Support services costs
- Inflationary impacts (input costs)
- Cost-containment discipline not uniform across Exxaro
- Difficult mining conditions and geological constraints
- Not achieving productivity indexes (benchmark standards)
- High fixed verse variable cost ratio
- Volatility of exchange rate
- Commodity price volatility
|
|
|
- Financial losses
- Social impact
- Reputational damage
- Margin squeeze
- Premature mine closure/allocation of costs to other operations
- Reduced earnings will impact approval of capital projects
|
|
|
- Assigned management accountants as business partners in relevant areas
- Budget for post-production stoppage (rehabilitation cost)
- Create strategic joint ventures to optimise economies of scale
- Embrace technology and innovation initiatives to improve productivity
- Focus on sustainable cost reduction programmes/business improvement initiatives
- Focus on business unit's controllable efficiencies
- Increased awareness of cost management
- Investigate and divest non-core and sub-par assets
- Optimise operating model and avoid duplicated activities
- Planned reviews by coal operations committee
- Rebalancing product chains to better use infrastructure (integrated logistics)
- Re-optimise capital in projects (mega projects and stay-in-business capital)
- Review and monitor performance of suppliers and service providers
|
|
|
|
| |
|
| |
|
|
|
|
|
|
|
|
|
|
|
|
|
|
|
|
|
|
|
|
|
|
|
|
|
|
|
| 9 |
INFRASTRUCTURE ACCESS & CAPACITY |
|
|
KPI: None |
|
|
Lines of defence: None |
|
|
|
|
|
|
|
|
|
|
|
| |
|
|
| |
| Main drivers |
| |
Impacts |
|
| Treatments |
- Delays in government infrastructure aspirations to assist with mining industry growth aspirations
- Process of engagement in finalising servitudes
- Ability of Transnet Freight Rail (TFR) to use available capacity
- Competition for limited infrastructure resources (especially in Waterberg)
- Geographical location (especially in Waterberg)
- Inability of RBCT (Richards Bay Coal Terminal) and TFR to ramp up to full capacity
- Stranded export entitlement
|
|
|
- Financial losses
- Reputational damage
- Opportunity losses for new employment
- Limitations on potential to expand
|
|
|
- 10-year take-or-pay agreement with TFR for coal dispatched to RBCT
- Collaborate with government stakeholders to improve and initiate new infrastructure
- Identify stakeholders to co-develop solutions and extend infrastructure (MCWAP)
- Manage service level agreements appropriately
- Regular liaison with TFR, RBCT and water stakeholders
- Understand the return on infrastructure spend and consider appropriate funding
|
|
|
|
| |
|
| |
|
|
|
|
|
|
|
|
|
|
|
|
|
|
|
|
|
|
|
|
|
|
|
|
|
|
|
| 10 |
FRAUD AND CORRUPTION |
|
|
KPIs: Fraud and corruption/asset destruction (annual % of PPE, inventory, debtors and cash) |
|
|
Lines of defence: 1, 2 and 3 |
|
|
|
|
|
|
|
|
|
|
|
| |
|
|
| |
| Main drivers |
| |
Impacts |
|
| Treatments |
- Collusion with major suppliers, service providers and agents
- Failure to comply with laws and regulations
- Lack of ethics internally and externally in SA context
|
|
|
- Penalties and fines
- Reputational damage
- Loss of assets
- Loss of opportunities and existing contractual agreements
- Criminal prosecution
|
|
|
- Business intelligence tools
- Conduct anti-fraud and corruption awareness campaigns
- Internal compliance and risk management assessments
- Consider go/no-go country framework as part of risk appetite framework
- Process control
- Consequence management
- Participate in industry forums
- Independent ethics hotline
- Internal investigation unit
- Third-party due diligence and research
- Continuous monitoring
|
|
|
|
| |
|
| |
|
|
|
|
|
|
|
|
|
|
|
|
|
|
|
|
|
|
|
|
|
|
|
|
|
|
|