Our ESG KPIs demonstrate our commitment to sustainable business practices and enable us to track our progress towards delivering on our strategic objectives and ESG goals. KPIs are informed by our integrated enterprise risk management (ERM) framework, which includes clearly defined material matters. The board and executive committee monitor, measure and manage Exxaro's strategy and performance each quarter, ensuring we deliver positive impact.
To ensure the integrity of our KPI reporting, select KPIs are assured as part of our combined assurance process. This also enables us to transparently report on the value we have created, preserved or eroded across the resources we use and impact (six capitals), and sustainability drivers.
Trend
![]() Progress has regressed or is needed
Progress has regressed or is needed
![]() Progress
has improved over three years
Progress
has improved over three years
![]() Progress
remains consistent towards achieving our target
Progress
remains consistent towards achieving our target
|
||||||||
| Strategic objective |
KPI | Target | 2024 | 2023 | 2022 | Trend | ||

|
Incidents | |||||||
| Reportable environmental incidents (levels 2 and 3) | 0 level 2s 0 level 3s |
0 level 2sRA 0 level 3sRA |
1 level 2 0 level 3 |
0 level 2s 0 level 3s |
 |
|||
 |
Compliance | |||||||
| Stoppage directives (includes section 54 in terms of MHSA*) | 0 | 0RA | 4 | 7 | |
|||
|
Stoppage directives (includes directives in terms of NWA, NEMA and MPRDA*) | 0 | 0RA | 0 | 0 |  |
||
|
|
Valid authorisations in place | |||||||
| Current operations | 100% | 100% | 100% | 100% | |
|||
| Projects | 100% | 100% | 100% | 100% | |
|||
|
|
Compliance to valid licences/authorisations in place** | |||||||
| Current operations | 100% | 97% | 97% | 100% | |
|||
| Projects | 100% | 100% | 100% | 100% | |
|||
|
|
Environmental liability provisions in place** | |||||||
| Commercial and captive operations*** | Between 80% and 100% |
Between 50% and 80% |
Between 50% and 80% |
Between 50% and 80% |
|
|||
 |
Environmental management | |||||||
| Carbon intensity (scope 1 tCO2e/total kilotonnes mined (kTTM)) | Actual for previous year less 5% |
3.4% increase | > 5% reduction | 0.5% increase |  |
|||
|
Carbon intensity (scope 2 tCO2e/kTTM) | Actual for previous year less 5% |
10.8% reduction | > 5% reduction | 0.8% increase | |
||
|
Water intensity (kL/tonne RoM****) | 0.15 to 0.18 | 0.14RA | 0.10 | 0.15 | |
||
| Physical rehabilitation (actual versus budget) | 0% deviation from budget |
0% deviation from budget |
Between 0% to 25% deviation from budget |
Between 25% and 50% deviation from budget |
|
|||
| RA | Reasonable assurance provided. |
| * | Mine Health and Safety Act, 1996 (Act 29 of 1996) (MHSA), National Water Act, 1998 (Act 36 of 1998) (NWA), National Environmental Management Act, 1998 (Act 107 of 1998) (NEMA) and Mineral and Petroleum Resources Development Act, 2002 (Act 28 of 2002) (MPRDA). |
| ** | Includes environmental authorisation, integrated water use licence (WUL), water management licence, atmospheric emissions licence, environmental impact assessment, record of decision and reporting. Regarding performance, there are scheduled and budgeted projects to address areas of non-compliance. |
| *** | The KPI measures against unscheduled costs, which are not currently regulated. In terms of scheduled costs, Exxaro remains compliant between 80% and 100%. The shortfall relates to the combination of unscheduled closure costs against the guarantee and trust fund balance. |
| **** | Run of mine (RoM). |
|
||||||||
| Strategic objective |
KPI | Target | 2024 | 2023 | 2022 | Trend | ||
| |
Safety | |||||||
| Number of fatalities | 0 | 0RA | 0 | 1 | |
|||
| LTIFR* | 0.05 | 0.06RA | 0.07 | 0.05 | |
|||
| LTIs* | 7 | 10RA | 11 | 7 | |
|||
| |
Health | |||||||
| Occupational health diseases | ** | 23RA | 23 | 23 | ||||
| OHIFR* reported | 0.13 | 0.14RA | 0.15 | 0.16 | |
|||
| Employees who received HIV/Aids awareness training | 95% | 99.12% | 92.92% | 116.5% | |
|||
| Employees who received awareness training and voluntarily tested for HIV/Aids | 68% and above | 94.3% | 69% | 70.6% | |
|||
| HIV/Aids prevalence rate compared to country prevalence rate | Less than the country prevalence rate |
1% vs 12% less than the country prevalence rate |
1% to 10% less than the country prevalence rate |
1% to 10% less the country prevalence rate |
|
|||
| |
Skills# | |||||||
| Skills provision (percentage of appointment of employees within) | 60% | 72.8%RA | 73.66% | 64% | |
|||
| Scarcity skills retention (percentage turnover) | 5% | 3.6%RA | 4.5% | 4.4% | |
|||
| |
Security | |||||||
| Fraud and corruption/asset destruction | 0% | 0% | 0% | 0% | |
|||
| RA | Reasonable assurance provided. |
| * | Lost-time injury frequency rate (LTIFR), lost-time injuries (LTIs) and occupational health incident frequency rate (OHIFR). |
| ** | No target set for 2024. |
| # | The operational effectiveness process completed in 2024 resulted in the decrease compared to the 2023 statistics. |
|
|
|||||||||||
| Strategic objective |
KPI | Target | 2024 | 2023 | 2022 | Trend | ||||||

|
Operational performance | |||||||||||
| System availability (Core P1 and enterprise resource planning solutions) | 97% | 99.68% | 98.66% | 97.49% | |
|||||||
| Information management projects (cost overrun) | 0% over budget | 41% under spent | 73% under spent | 5% under budget | |
|||||||
| Information management projects (time overrun) | 0% behind schedule |
29% behind schedule |
22% behind schedule |
0% behind schedule |
|
|||||||
|
||||||||
| Strategic objective |
KPI | Target | 2024 | 2023 | 2022 | Trend | ||
|
EBITDA** margin (managed operations) (%) | 29 | 26 | 35 | 41 | |
||
|---|---|---|---|---|---|---|---|---|
| ROCE** (%) | >20 | 23 | 35 | 45 | |
|||
| Solvency ratio (times) | 2 to 3 | 3.6 | 3.5 | 3.3 | |
|||
| ** | Earnings before interest, tax, depreciation and amortisation (EBITDA), and return on capital employed (ROCE). |
| * | Historically disadvantaged person (HDP), net profit after tax (NPAT) and social and labour plans (SLPs). |
| # | The trend-based indicators are in accordance with Exxaro's internal sustainability framework. |
* Refer to SLP performance.
We benchmark our ESG performance against our peers who exhibit the global best practice expected by responsible investors. Global ratings agencies assess our ESG performance using publicly available information (annual reports, websites and media) in line with various criteria requirements.
We aim to improve our disclosure by engaging with ratings agencies, ensuring we report transparently and that our reporting is accessible to a broad range of stakeholders.
As a result of our ESG approach, we proudly benchmark above our peers in global ESG best practice.
|
Our score
|
||
 |
FTSE Russell's ESG scores and data model allows investors to understand a company's exposure to, and management of, ESG issues in multiple dimensions. The index series measures our ESG risks and impact performance in terms of themes relevant to our mining context. |
4/5 overall ESG score Over the past six years, we have consistently achieved good scores, demonstrating our commitment to improving our performance. Our rating increased slightly from last year, and we remain ranked in the top quartile of global performers in the basic resources supersector. |
FTSE Russell ESG Index – Exxaro's historical performance (score out of 5)
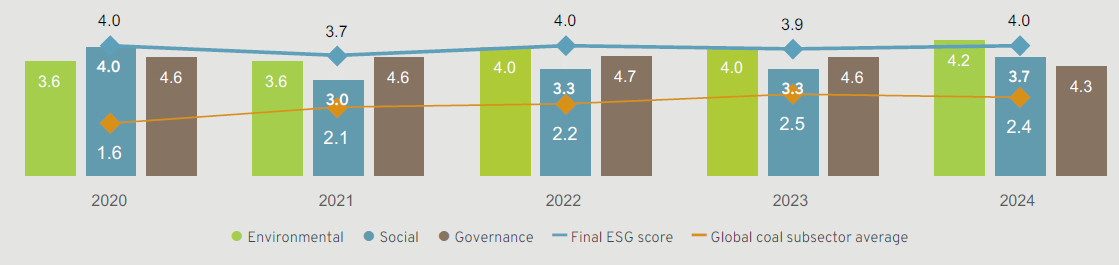
Source: FTSE Russell Corporate Performance Results.
|
Our score
|
||
 |
The Bloomberg Gender Equality Index encourages organisations to improve their gender-related policies and practices through fostering greater transparency and accountability. The index includes public companies from various organisations, and tracks their performance and progress in gender equality and advancing women in the workplace. | Exxaro was recognised in the 2024 Gender Equality Index for the fourth consecutive year – a testament to our commitment to gender equality and inclusion. |
 |
MSCI ESG Ratings evaluate and benchmark companies' ESG performance across various industries, enabling investors to integrate ESG considerations into their decision making and identify sustainable investment opportunities. |
Exxaro was rated as A Although this rating is slightly below the AA rating received in 2023, Exxaro remains one of the top performers among our peers' ESG reports. Areas of disclosure improvement include our high exposure to safety risks, environmental liabilities and an inadequate anti-corruption policy. |
 |
The Transition Pathway Initiative compares companies' expected future carbon emissions with local and international targets as part of the Paris Agreement. It is used as a benchmark to determine commitment to corporate climate action. A high Transition Pathway Initiative ranking demonstrates that a company is strategically mitigating climate change and its effects. |
4/4 rating We have achieved this rating for the past three years demonstrating our commitment to manage greenhouse gas (GHG) emissions, which shows stakeholders that Exxaro is well positioned to benefit from opportunities presented by the low-carbon transition. |
 |
Institutional Shareholder Services empowers investors and companies to build long-term sustainable growth by providing high-quality data, analytics and insight. |
Exxaro was ranked at C- This rating shows that we have a high transparency level, demonstrating our continued commitment to good corporate governance. Areas for disclosure improvement include publication and disclosure of our stance on political contributions as well as the integration of contractors into our safety management systems. |
 |
The Sustainalytics ESG rating measures exposure to industry-specific material risks (including company-specific factors such as the business model) and the company's management of those risks. |
37.2 ESG risk rating Exxaro's exposure was rated high and management was rated strong, which indicates the robustness of our ESG programmes, practices and policies. We regularly assess feedback from other ratings agencies to identify common assessment areas and improvement opportunities. |
 |
S&P Global ESG Scores assess companies' risk management related to ESG factors, and comment on companies' overall sustainability and levels of responsibility. A high score indicates good management of ESG issues. |
50/100 ESG score Our scores in the ESG and economic categories are above the industry averages. We also achieved a very high data availability rating, highlighting our focus on transparency. |