Exxaro Resources Limited
Integrated report for the year ended 31 December 2025


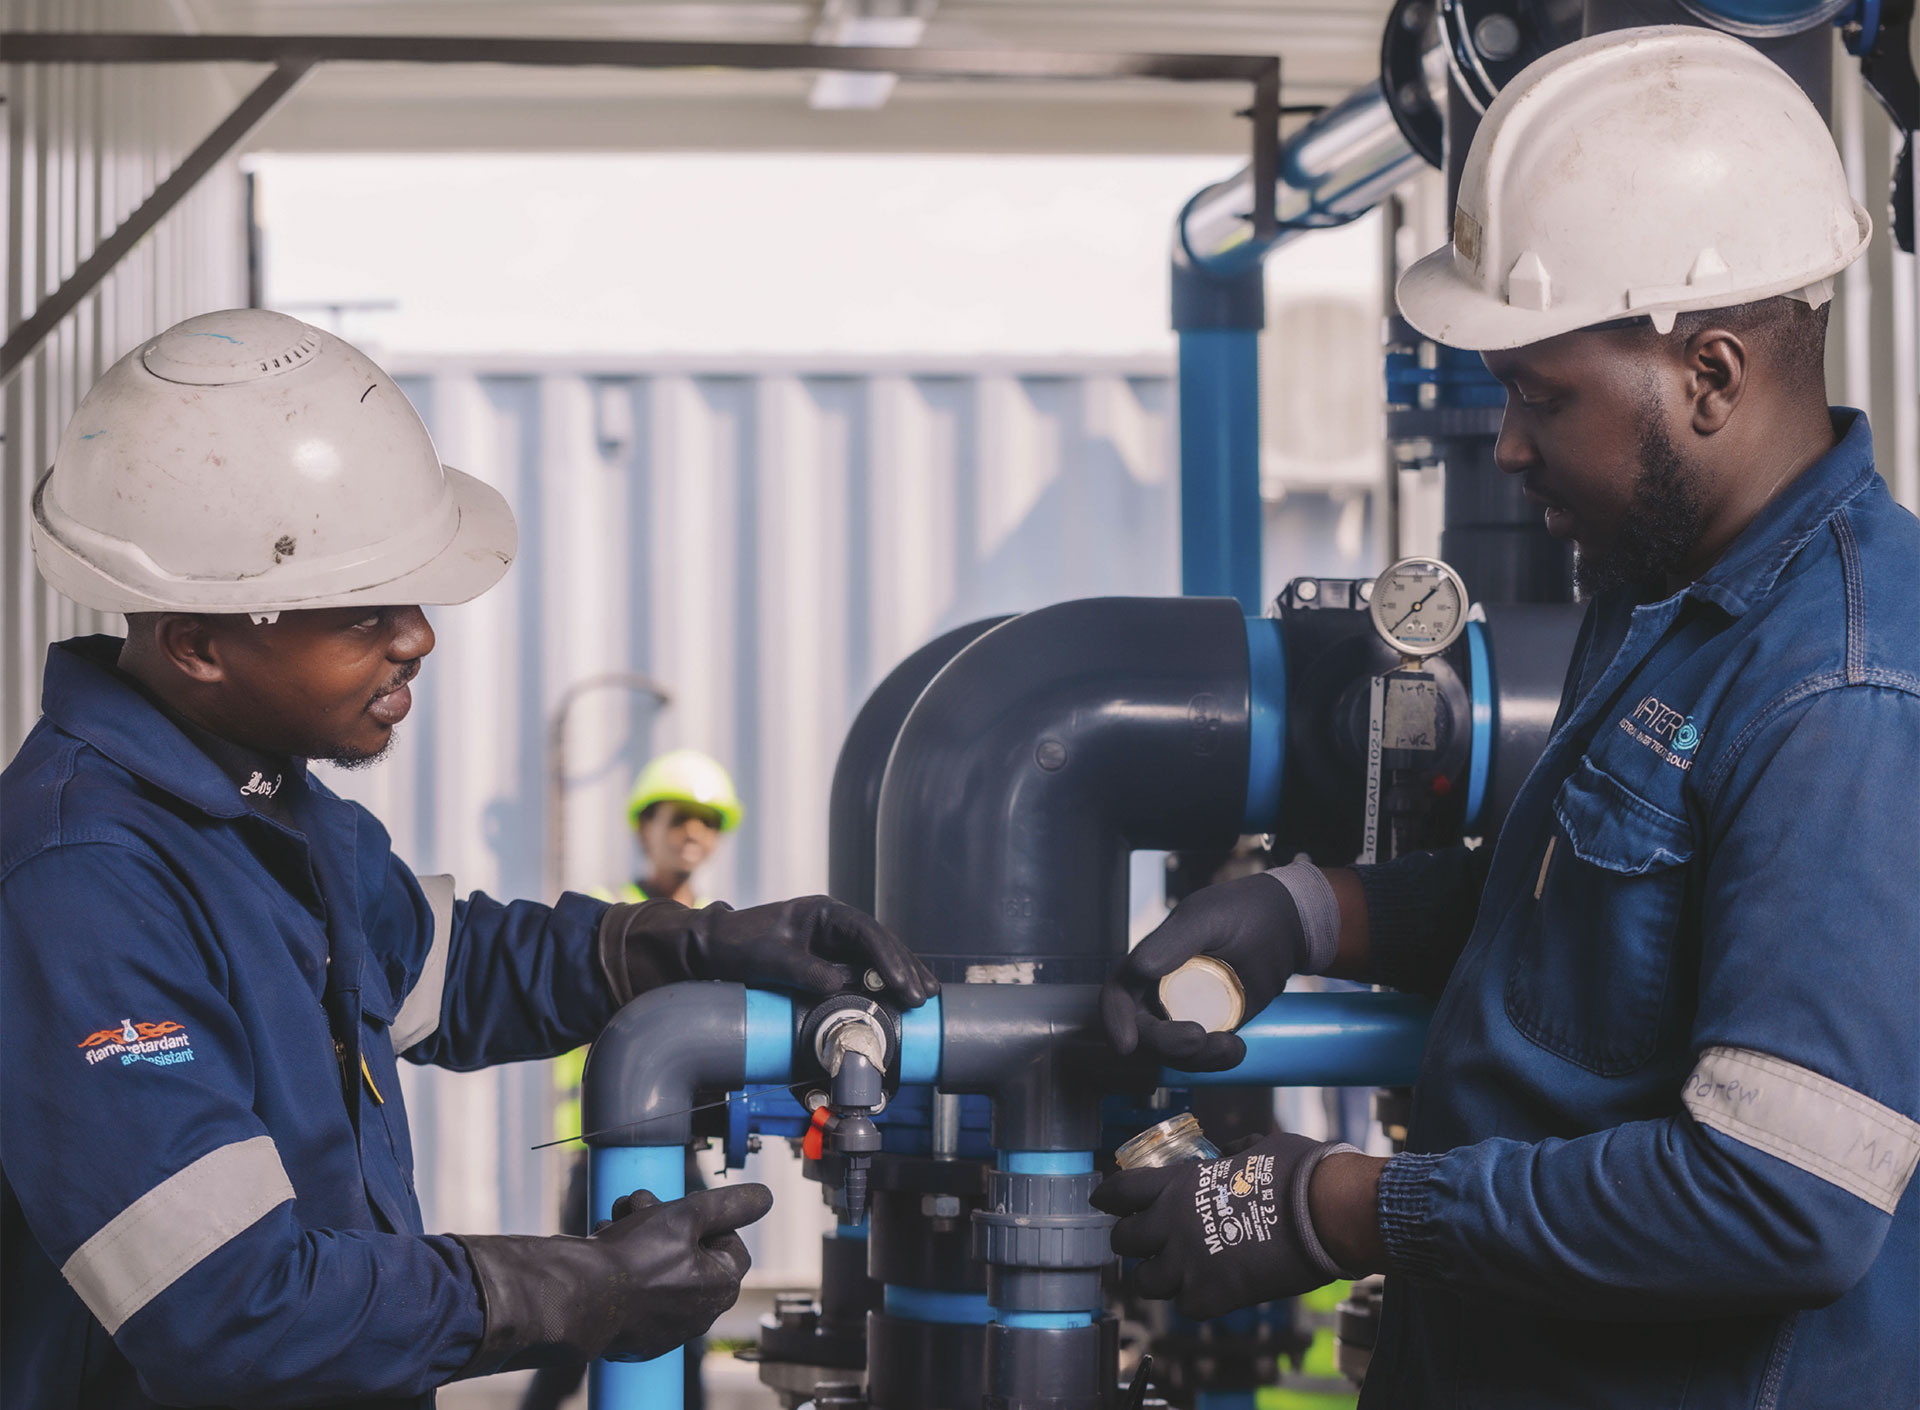
Managing and enhancing financial capital is essential to advancing sustainable growth, delivering against our strategy and creating long-term value for stakeholders.
Our financial capital is the financial resources we generate and manage that enable us to execute our strategy. It is the foundation of our ability to drive sustainable growth and achieve our purpose of powering better lives in Africa and beyond.
Financial capital supports our operations, fuels innovation and allows us to invest in portfolio diversification. By maintaining a balanced approach to capital allocation, we generate shareholder returns while investing in initiatives that create long-term economic, environmental and social value.
| Material theme | Matters | Strategies to achieve our objectives | Related strategic objectives | Our broader impact | ||
|
Adapting to a changing context |
|
|
||||
|
Driving business resilience |
|
|
||||
|
Executing our strategy |
|
|
Looking
ahead
As we enter 2026, we remain focused on navigating global uncertainties while strengthening our operational resilience.
Global coal demand will be shaped by geopolitical factors and energy security needs, while domestic demand may strengthen as Eskom addresses operational challenges. Infrastructure constraints persist, but we are actively exploring alternative routes to market. Iron ore prices remain under pressure due to rising supply, though early signs of recovery in Chinese demand offer a potential upside.
The commissioning of the LSP, as well the forecast contribution from the Gouda windfarm and Sishen solar plant, will expand our renewable energy capacity, reinforcing our commitment to a low-carbon future.
Amid shifting commodity markets and geopolitical pressures, we will prioritise cost efficiency, supply chain agility and strategic diversification to drive long-term growth and stakeholder value.
Read our annual financial statements for details about our financial performance.
In 2025, Exxaro delivered a strong financial performance, driven by operational, cost and marketing efficiencies, despite facing a challenging macro-economic environment. Group revenue increased to R41.8 billion (2024: R40.7 billion), mainly driven by a 3% rise in coal revenue. Our disciplined approach to cost management limited coal production cost increases to 0.4%. As a result, group EBITDA declined marginally by 2% to R10.2 billion (2024: R10.4 billion), delivering an EBITDA margin of 24%. The contribution from our non-controlled operations increased by 5% to R4.5 billion (2024: R4.3 billion). This translated into basic HEPS of R32.47 compared to R30.16 in 2024. In line with our revised dividend policy, we are pleased to have declared a final cash dividend to shareholders of R10 per share.
Riaan Koppeschaar
Financial Director

Exxaro’s portfolio of high-quality, well-capitalised assets, supported by disciplined operational execution and effective working capital management, continues to deliver strong and consistent performance and cash generation.
| * | EBITDA is calculated by adjusting net operating profit before interest, tax, depreciation, amortisation, impairment charges or impairment reversals and net losses or gains on disposal of assets and investments (including translation differences recycled to profit or loss). |
Since taking office in January 2025, US President Donald Trump implemented a series of tariffs and trade measures following multiple rounds of escalation and subsequent easing. These policy shifts reshaped global trade dynamics, weighing on international sentiment and contributing to heightened financial market volatility and the weakening of the US dollar. Despite these headwinds, overall global economic activity maintained positive momentum through 2025.
In 2025, the thermal coal market faced lower seaborne demand, ongoing oversupply, and pricing pressure, with benchmark prices falling below US$80 per tonne. Weak import demand, especially from India, reflected slower industrial activity, stronger renewables, and ample domestic supply, while demand across Asia and Europe generally softened as gas, nuclear, and clean energy gained ground.
Domestically, coal demand remained stable, with resilience supported by premium coal demand and flexible redirection to local markets. In the Waterberg, coal offtake from Grootegeluk remained subdued due to operational constrains at the Matimba power station. This was partially offset by the successful return of Unit 4 at the Medupi power station.
South Africa accelerated its renewable energy transition in 2025 through firm policy execution and market reform. Cabinet approved the South African Renewable Energy Masterplan, targeting 3GW to 5GW of new renewable capacity annually by 2030, while the IRP 2025 outlines large-scale capacity expansion through to 2039. Private sector offtake remains the primary driver of new generation despite regulatory and grid constraints.
To address grid-access limitations, the National Energy Regulator of South Africa approved a temporary congestion curtailment mechanism (1 April 2025 to 31 March 2028), enabling approximately 3.4GW of wind capacity.
Transmission expansion progressed via the Independent Transmission Programme, with seven consortia selected to develop 1 164km of new 400kV lines across key provinces. Market reforms also advanced with preparations for the South African Wholesale Electricity Market. These developments support Exxaro’s low-carbon growth opportunities.
| 2025 Rm |
2024 Rm |
||
| Revenue | 41 771 | 40 725 | |
|---|---|---|---|
| Operating expenses | (34 656) | (33 118) | |
| Operating profit | 7 115 | 7 607 | |
| Gain on disposal of subsidiary | 32 | ||
| Net operating profit | 7 147 | 7 607 | |
| Finance income | 1 739 | 1 786 | |
| Finance costs | (1 124) | (1 216) | |
| Share of income of equity-accounted investments | 4 488 | 4 270 | |
| Profit before tax | 12 250 | 12 447 | |
| Income tax expense | (2 390) | (2 377) | |
| Profit for the year | 9 860 | 10 070 | |
| Other comprehensive income/(loss), net of tax | (547) | (99) | |
| Total comprehensive income for the year | 9 313 | 9 971 |
Group revenue increased to R41 771 million (2024: R40 725 million), mainly driven by a 3% rise in coal revenue, from higher sales volumes to Eskom from Matla. This was partly offset by lower demand from AMSA and reduced export prices with a stronger Rand to US dollar exchange rate. Our realised average export price decreased by 14% to US$86 per tonne (2024: US$100 per tonne), in line with the decrease in the average API4 coal benchmark price. We achieved a 96% price realisation compared to 95% in 2024.
Cennergi’s assets generated 703GWh of renewable energy for 2025 (2024: 725GWh). Although the average plant availability of 98% exceeded the contracted levels of 97%, wind conditions were weaker than in the prior year. As a result, revenue remained largely unchanged at R1 410 million (2024: R1 411 million).
Group operating costs increased 5% to R34 656 million (2024: R33 118 million). Across the mining industry, inflation continued to elevate our cost base with electricity increasing by 12.7%, labour costs rising by 6.7% on average, and other costs tracking Producer Price Index at 1.5%. Diesel was the exception, helping to offset some of the inflationary impacts with a 7% decrease. Despite inflationary pressures, coal production costs (excluding Matla and Mafube) increased marginally by only 0.4%, reflecting the group’s continued focus on disciplined cost management. Matla is excluded as it is a tied mine, while Mafube buy-ins are priced with reference to the API4 coal benchmark. In addition to the energy operational costs, the group incurred costs associated with its energy acquisitions. Transaction costs of R178 million was also recognised in relation to the manganese acquisition. The stronger rand to US dollar exchange rate also resulted in realised and unrealised foreign exchange losses on foreign debtors and cash balances.
We incurred an increase in borrowing costs, mainly relating to specific borrowings utilised by the LSP and Karreebosch windfarm, which is in the construction phase.
Income of equity-accounted investments has been adjusted for headline earnings adjustments in the table below.
| Income from equity- accounted investments |
Dividends received | ||||||
| 2025 Rm |
2024 Rm |
Change % |
2025 Rm |
2024 Rm |
Change % |
||
| Coal: Mafube | 66 | 234 | (72) | 100 | 130 | (23) | |
|---|---|---|---|---|---|---|---|
| Coal: RBCT | (21) | (7) | <100 | ||||
| Metals: SIOC | 3 954 | 3 979 | (1) | 3 267 | 3 741 | (13) | |
| Metals: Black Mountain | 489 | 64 | >100 | ||||
| Total | 4 488 | 4 270 | 5 | 3 367 | 3 871 | (13) | |
Income from equity-accounted investments increased to R4 488 million (2024: R4 270 million), driven by:
The group’s effective tax rate increased to 30.8% (2024: 29.1%).
Net operating profit is sensitive to a number of key variables relating to our coal business, primarily commodity prices, exchange rates, input costs and discount rates as outlined below:
| Sensitivity | Net operating profit impact Rm |
||
| Environmental rehabilitation discount rate decrease | 1% | (237) | |
|---|---|---|---|
| Environmental rehabilitation discount rate increase | 1% | 217 | |
| Domestic sales volume increase1 | 1% | 391 | |
| Royalty cost increase1 | 1% | (278) | |
| Production cost increase1 | 1% | (174) | |
| Export price per tonne increase1 | US$1 | 128 | |
| Export sales volumes increase1 | 1% | 59 | |
| Exchange rate increase1 | 10 cents | 46 | |
| Labour increase1 | 1% | (42) | |
| Logistics increase1 | 1% | (37) | |
| Fuel increase1 | 1% | (17) | |
| Energy increase1 | 1% | (9) |
| 1 | An increase/decrease has equal and opposite impact on the net operating profit. |
The group’s statement of financial position provides the foundation for disciplined capital allocation, ensuring that investments, returns to shareholders and growth initiatives are pursued within clearly defined financial parameters.
| 2025 Rm |
2024 Rm |
||
| Assets | |||
| Non-current assets | 70 547 | 66 799 | |
| Property, plant and equipment | 39 667 | 37 292 | |
| Intangible assets | 2 613 | 2 598 | |
| Right-of-use assets | 626 | 281 | |
| Equity-accounted investments | 21 592 | 20 596 | |
| Financial assets | 5 015 | 5 266 | |
| Deferred tax | 388 | 197 | |
| Other assets | 646 | 569 | |
| Current assets | 32 663 | 27 917 | |
| Inventories | 2 790 | 2 427 | |
| Financial assets | 1 259 | 159 | |
| Trade and other receivables | 4 283 | 4 230 | |
| Cash and cash equivalents | 23 690 | 20 630 | |
| Current tax receivables | 86 | 15 | |
| Other assets | 555 | 456 | |
| Total assets | 103 210 | 94 716 | |
| Equity and liabilities | |||
| Capital and other components of equity | |||
| Share capital | 952 | 983 | |
| Other components of equity | 834 | 1 119 | |
| Retained earnings | 54 189 | 51 885 | |
| Equity attributable to owners of the parent | 55 975 | 53 987 | |
| Non-controlling interests | 15 275 | 14 563 | |
| Total equity | 71 250 | 68 550 | |
| Non-current liabilities | 25 555 | 20 351 | |
| Interest-bearing borrowings | 11 259 | 7 344 | |
| Lease liabilities | 675 | 334 | |
| Other payables | 11 | 40 | |
| Provisions | 3 681 | 3 359 | |
| Retirement employee obligations | 191 | 181 | |
| Financial liabilities | 398 | 129 | |
| Deferred tax | 9 301 | 8 926 | |
| Other liabilities | 39 | 38 | |
| Current liabilities | 6 405 | 5 815 | |
| Interest-bearing borrowings | 938 | 876 | |
| Lease liabilities | 104 | 96 | |
| Trade and other payables | 3 897 | 3 351 | |
| Provisions | 355 | 282 | |
| Financial liabilities | 22 | 22 | |
| Current tax payables | 77 | 214 | |
| Other liabilities | 1 012 | 974 | |
| Total liabilities | 31 960 | 26 166 | |
| Total equity and liabilities | 103 210 | 94 716 |
Our balance sheet remains strong and flexible, underpinned by robust cash generation and prudent capital allocation. Strong operational cash generation increased the group’s net cash position (excluding energy’s net debt) to R17 641 million as at 31 December 2025. Energy’s net debt amounted to R6 927 million, with limited recourse to Exxaro’s balance sheet and hedged through interest rate swaps.
For more details on specific line items, refer to the group and company annual financial statements for the year ended 31 December 2025.
Despite the operational challenges experienced in 2025, all internal KPIs are well within target, indicating a healthy balance sheet and strong cash flow generation. The group has complied with all the bank covenants for the year ended 31 December 2025.
The diagram below illustrates how the group’s strong statement of financial position informs and supports its capital allocation framework. In applying it, we aim for a gearing ratio of below 1.5 times net debt (excluding ring-fenced project financing) to EBITDA. The framework aligns with our commitment to sustainably return cash to shareholders through the cycle while retaining a strong financial position.
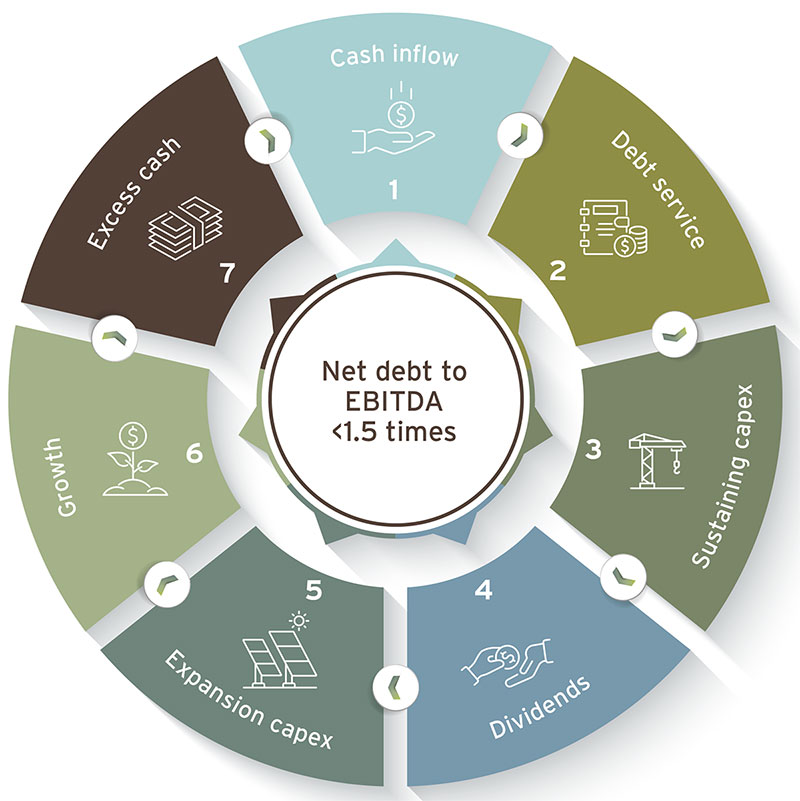
Following the completion of the acquisition of the select manganese assets from Ntsimbintle Holdings and OMH, the group will no longer maintain the previously targeted cash buffer of R12 billion to R15 billion and has reviewed its capital allocation framework. Consequently, the dividend cover ratio range has been revised from 2.5 times to 3.5 times Adjusted Group Earnings to a range of 1.5 times to 2.5 times, while the 100% pass-through of the SIOC dividend remains unchanged.
In line with the revised lower dividend cover range, the board has declared a final gross cash dividend of 1 000 cents per share, amounting to approximately R3.4 billion. Including the interim dividend of R2.9 billion paid in October 2025, total dividends for 2025 amount to R4.1 billion. This reflects our ongoing commitment and consistency in delivering superior and consistent returns to our shareholders.
Refer below to our capital funding structure for Exxaro (excluding energy) as well as energy on a standalone basis:
During the year, we successfully concluded the refinancing of R13 billion in term loan facilities. The transaction strengthens the group’s liquidity position, extends debt maturities and enhances balance sheet flexibility, supporting the execution of our strategic objectives.
| Facilities available | |||||||
| Drawn Rm |
Undrawn/ committed Rm |
Uncommitted Rm |
|||||
| Term loan and revolving facility | 4 500 | 5 500 | 3 0001 | ||||
|---|---|---|---|---|---|---|---|
| Domestic medium-term note programme | 5 0002 | ||||||
| Interest-bearing borrowings | 4 500 | ||||||
| Interest capitalised | 29 | Maturity profile of debt | |||||
| Lease liabilities | 686 | Rm | |||||
| Capitalised transaction costs | (23) | Repayment period | 5 192 | ||||
| Total interest-bearing debt | 5 192 | Less than six months | 272 | ||||
| Current | 515 | Six to 12 months | 243 | ||||
| Non-current | 4 677 | One to two years | 485 | ||||
| Net cash and cash equivalents | (22 833) | Two to three years | 485 | ||||
| Net cash | (17 641) | Three to four years | 477 | ||||
| Four to five years | 2 977 | ||||||
| More than five years | 253 | ||||||
| 1 | Uncommitted Accordion facility. |
| 2 | Uncommitted but available on market take-up. |
| Facilities available | ||||||
| Drawn Rm |
Undrawn/ committed Rm |
|||||
| Project financing | 7 675 | 2 135 | ||||
|---|---|---|---|---|---|---|
| Interest-bearing borrowings | 7 675 | Maturity profile of debt | ||||
| Interest capitalised | 60 | Rm | ||||
| Lease liabilities | 93 | Repayment period | 7 784 | |||
| Capitalised transaction costs | (44) | Less than six months | 279 | |||
| Total interest-bearing debt | 7 784 | Six to 12 months | 248 | |||
| Current | 527 | One to two years | 568 | |||
| Non-current | 7 257 | Two to three years | 691 | |||
| Net cash and cash equivalents | (857) | Three to four years | 817 | |||
| Net debt | 6 927 | Four to five years | 952 | |||
| More than five years | 4 229 | |||||
Building on the Group’s balance sheet position, the statement of cash flows outlines the movements in cash during the year and how cash generation was deployed to support operations, strategic investments and capital management priorities.
| 2025 Rm |
2024 Rm |
||
| Cash flows from operating activities | 8 380 | 8 425 | |
|---|---|---|---|
| Cash generated by operations | 10 040 | 10 432 | |
| Interest received | 1 680 | 1 720 | |
| Interest paid | (1 059) | (1 095) | |
| Tax paid | (2 281) | (2 632) | |
| Cash flows from investing activities | (1 867) | 1 084 | |
| Property, plant and equipment acquired | (5 099) | (2 448) | |
| Intangible assets acquired | (33) | (27) | |
| Proceeds from disposal of property, plant and equipment | 1 | ||
| Cash received from other financial assets at amortised cost | 141 | 111 | |
| ESD loans granted | (76) | (130) | |
| ESD loans settled | 117 | 84 | |
| Intervention receivable granted | (57) | (33) | |
| Deposit facilities placed | (360) | (360) | |
| Lease receivables settled | 16 | 16 | |
| Proceeds from disposal of subsidiary | 116 | ||
| Dividends received from equity-accounted investments | 3 367 | 3 871 | |
| Cash flows from financing activities | (3 192) | (8 742) | |
| Interest-bearing borrowings raised | 7 365 | 705 | |
| Interest-bearing borrowings repaid | (3 375) | (1 397) | |
| Transaction costs paid on interest-bearing borrowings raised | (57) | ||
| Acquisition debt settled | (180) | ||
| Lease liabilities | (62) | (50) | |
| Dividends paid to owners of the parent | (4 071) | (5 744) | |
| Dividends paid to non-controlling interest BEE Parties | (1 382) | (1 893) | |
| Dividends paid to non-controlling interest of Tsitsikamma SPV and Amakhala SPV | (37) | (42) | |
| Shares acquired in the market to settle share-based payments | (173) | (321) | |
| Shares repurchased including transaction costs | (1 220) | ||
| Net increase in cash and cash equivalents | 3 321 | 767 | |
| Cash and cash equivalents at beginning of the year | 20 630 | 19 859 | |
| Translation difference on movements in cash and cash equivalents | (261) | 4 | |
| Cash and cash equivalents at end of the year | 23 690 | 20 630 |
Total capex increased to R5 099 million (2024: R2 448 million), comprising:
The group received R3.3 billion (2024: R3.7 billion) from SIOC for dividends.
The group paid R5.5 billion (2024: R7.7 billion) in dividends, including the R3.3 billion (2024: R3.7 billion) passed through from SIOC, and R2.2 billion (2024: R4.0 billion) from our managed operations.
A total of 7 391 418 shares were repurchased and cancelled, representing 2.1% of Exxaro’s issued share capital prior to the repurchase.
The group’s strategic treasury function predominantly provides financial risk management services to the business, coordinates access to domestic and international financial markets, and monitors and manages the financial risks relating to the operations of the group through internal risk reports that analyse exposure by degree and magnitude of risks. These risks include market risk (including foreign currency risk, interest rate risk and price risk), credit risk and liquidity risk.
In managing its capital, the group focuses on a prudent gearing position, return on shareholders’ equity (or ROCE) and the level of dividends to shareholders. The group’s policy is to cover its annual net funding requirements through long-term loan facilities with maturities spread over time. Neither the company nor any of its subsidiaries are subject to externally imposed capital requirements.
Market risk is the risk that changes in market prices, such as foreign exchange rates, interest rates and equity prices, will affect profit or the value of its holdings of financial instruments. The objective of market risk management is to manage and control market risk exposure within acceptable parameters, while optimising the return on risk.
The group’s activities expose it primarily to the financial risks of changes in the environmental rehabilitation funds, portfolio investment and deposit facilities quoted prices, foreign currency exchange rates and interest rates. The group enters into a variety of derivative financial instruments to manage its exposure to foreign currency risk and interest rate risks, including:
The group’s exposure to equity price risk arises from investments held by and classified as at fair value through other comprehensive income or at fair value through profit or loss. The group’s exposure to price risk in relation to quoted prices of the environmental rehabilitation funds, portfolio investments and deposit facilities is not considered a significant risk as the funds are invested with reputable financial institutions in accordance with a strict mandate to ensure capital preservation and growth. The funds are held for strategic purposes rather than trading purposes.
Certain transactions are denominated in foreign currencies, hence exposures to exchange rate fluctuations arise. The currency in which transactions are entered into is mainly denominated in US dollar, euro, and Australian dollar. Exchange rate exposures are managed within approved policy parameters utilising FECs, currency options and currency swap agreements.
The group maintains a fully covered exchange rate position in respect of foreign balances (if any) and imported capital equipment resulting in these exposures being fully converted to rand. Trade‑related import exposures are managed through the use of economic hedges arising from export revenue as well as through FECs. Trade-related export exposures are hedged using FECs and currency options with specific focus on short-term receivables. Any open exposure to foreign currency risk on these balances is insignificant as the turnaround time is generally less than 30 days. Foreign denominated capital purchases funded by rand-denominated project financing arrangements are hedged using FECs.
Monetary items have been translated at the closing rate at the last day of the reporting period.
The FECs that are used to hedge foreign currency exposure mostly have a maturity of less than one year from the reporting date. When necessary, FECs are rolled over at maturity.
For more details, refer to note 16.3.3.2.2 of the group and company annual financial statements for the year ended 31 December 2025.
The group is exposed to interest rate risk as it borrows and deposits funds at floating interest rates on the money market and extended bank borrowings. The group’s main interest rate risk arises from long-term borrowings with floating rates, which expose the group to cash flow interest rate risk. The risk is managed by undertaking controlled management of the interest structures of the investments and borrowings, maintaining an appropriate mix between fixed and floating interest rate facilities in line with the interest rate expectations. The group also uses interest rate swaps and interest rate forwards to manage the interest rate risk exposure.
When the contractual terms of the borrowings and covenants thereof require the use of hedging instruments to mitigate the risk of fluctuations of the underlying interest rate risk cash flow exposure and the impact on profit or loss of specific projects being financed, the group looks to apply hedge accounting where an effective hedge relationship is expected and to the extent that such exposure poses a real risk to the achievement of the loan covenants.
The financial institutions chosen are subject to compliance with the relevant regulatory bodies.
For details on loan facility and bonds, refer to note 16.3.3.2.3.1 of the group and company annual financial statements for the year ended 31 December 2025.
The group is exposed to the risk of variability in future interest payments on the project financing, attributable to fluctuations in the three-month Johannesburg Interbank Average Rate during the operations phase, and the one-month Johannesburg Interbank Average Rate during the construction phase. The designated hedged item is the group of expected floating interest rate cash flows arising from the project financing, up to the notional amount of each interest rate swap, over the term of the hedging relationship. The notional amounts per interest rate swap match up to the designated exposure being hedged.
Where all relevant criteria are met, hedge accounting is applied to remove the accounting mismatch between the hedging instrument and the hedged item. This will effectively result in recognising interest expense at a fixed interest rate for the hedged project financing.
For details on project financing, refer to note 16.3.3.2.3.2 of the group and company annual financial statements for the year ended 31 December 2025.
Liquidity risk is the risk that the group will not be able to meet its financial obligations as they fall due. The group’s approach to managing liquidity is to ensure, as far as possible, that it will always have sufficient liquidity to meet its liabilities when due, under normal and stressed conditions, without incurring unacceptable losses or risking damage to the group’s reputation.
The ultimate responsibility for liquidity risk management rests with the board of directors, which has built an appropriate liquidity risk management framework for the management of the group’s short, medium, and long-term funding and liquidity management requirements.
The group manages liquidity risk by monitoring forecast cash flows in compliance with loan covenants and ensuring that adequate unutilised borrowing facilities are maintained.
Borrowing capacity is determined by the board of directors, from time to time.
| 2025 Rm |
2024 Rm |
||
| Amount approved | 69 969 | 67 484 | |
|---|---|---|---|
| Total borrowings | (12 197) | (8 220) | |
| Unutilised borrowing capacity | 57 772 | 59 264 |
The group’s capital base and the borrowing powers of the company and the group were set at 125% of shareholders’ funds (equity attributable to owners of the parent) for both the 2025 and 2024 financial years.
To avoid incurring interest on late payments, financial risk management policies and procedures are entrenched to ensure the timeous matching of orders placed with goods received notes or services acceptances and invoices.
Credit risk relates to potential default by counterparties on cash and cash equivalents, loans, investments, trade receivables and other receivables.
The group limits its counterparty exposure arising from money market and derivative instruments by only dealing with well-established financial institutions of high credit standing. The group’s exposure and the credit ratings of its counterparties are continuously monitored. The aggregate value of transactions concluded is spread among approved counterparties. Credit exposure is controlled by counterparty limits that are reviewed and approved by the audit committee annually.
Trade receivables consist of a number of customers with whom Exxaro has long standing relationships. A high portion of term supply arrangements exists with such customers resulting in limited credit exposure which exposure is limited by performing customer creditworthiness or country risk assessment.
The group strives to enter into sales contracts with customers which stipulate the required payment terms. It is expected of each customer that these payment terms are adhered to. Where trade receivable balances become past due, the normal recovery procedures are followed to recover the debt, where applicable new payment terms may be arranged to ensure that the debt is fully recovered.
Exxaro has concentration risk as a result of its exposure to one major customer. This is, however, not considered significant, as the customer adheres to the stipulated payment terms.
Exxaro establishes an allowance for non-recoverability or impairment that represent its estimate of expected credit losses in respect of trade receivables, other receivables, loans, cash and cash equivalents and investments.
For Exxaro’s exposure to credit risk, refer to note 16.3.3.4.1 of the group and company annual financial statements for the year ended 31 December 2025.
The current year commenced against a backdrop of heightened geopolitical and related risks. Global uncertainty increased meaningfully due to evolving developments in Venezuela, Iran and Greenland, alongside the continued unpredictability surrounding the US’s trade policy.
Domestically, South Africa recorded modest real GDP growth in 2025, with this positive momentum expected to extend into 2026. Structural reforms across the energy, water, ports, and rail sectors progressed steadily, supported by a strong emphasis on public-private partnerships aimed at strengthening public sector infrastructure.
South Africa’s removal from the Financial Action Task Force grey list in October 2025, coupled with S&P Global Ratings’ upgrade of the foreign currency sovereign credit rating from BB‑ to BB in November 2025, while maintaining a positive outlook, represents significant progress toward regaining an investment-grade rating.
Adequate thermal coal and gas inventories, combined with a milder Northern Hemisphere winter, limited the typical year-end price uplift in 2025. However, reduced nuclear availability in South Korea, cutbacks in Colombia’s thermal coal supply, and the potential for restricted US export availability provided a more supportive backdrop heading into 2026.
Looking ahead, China and India’s increasing focus on domestic coal production, rising renewable energy penetration and expectations of stronger gas price competition in key markets, are likely to shape market dynamics in 2026. The global transition towards renewables continues to define longer-term trends. Short-term supply constraints, the expansion of electrification, and broader global economic and geopolitical developments will remain important drivers of thermal coal demand and pricing.
The Middle East conflicts present a material risk to global energy security and freight markets. Any prolonged or broader regional destabilisation would disrupt energy security and bulk shipping, tightening global oil and LNG supply. This would likely increase reliance on alternative fuels, supporting higher thermal coal demand and prices.
Domestically, improved economic activity may stimulate coal demand, particularly as Eskom advances in resolving operational challenges. In spite of TFR’s improving performance, it remains well below RBCT’s port capacity. Therefore, Exxaro continues to pursue all commercially viable routes to meet customer needs and unlock value.
In the iron ore market, rising supply is returning, with the commissioning of the Simandou project, Africa’s largest greenfield integrated mining and infrastructure development in Guinea, together with the subdued demand from China.
Our business is still impacted by commodity prices, domestic structural challenges, coal offtake and both the global and domestic geopolitical environment.
We provide the following guidance for the 2026 financial year:
Riaan Koppeschaar
Finance director
29 April 2026