Exxaro Resources Limited
Annual Financial Statements 2022
 R46.4 billionR19.0 billionR60.16 per shareR18.9 billion
Group revenue increased 41% to R46 369 million (2021: R32 771 million), mainly due to exceptional performance of the coal business driven by higher export and domestic sales prices, despite the ongoing logistical challenges.
Earning increased by 9% to R13 826 million (2021: R12 667 million) or 5 713 cps (2021: 5 128 cps). The increase in earnings was mainly due to higher revenue as result of the higher export and domestic sales prices offset by lower equity-accounted income from associates. SIOC's equity-accounted income was 55% lower as a result of an impairment charge recognised on the Kolomela assets, lower market prices and volumes as well as higher operating expenses which were partially offset by a weaker currency.
Headline earnings increased to R14 558 million (2021: R11 568 million) or 6 016 cps (2021: 4 683 cps). There was a decrease in the WANOS to 242 million (2021: 247 million) as a result of the shares that were bought back in 2021 as part of the share repurchase programme.
Refer note 5.3 for the detailed headline earnings reconciliation.
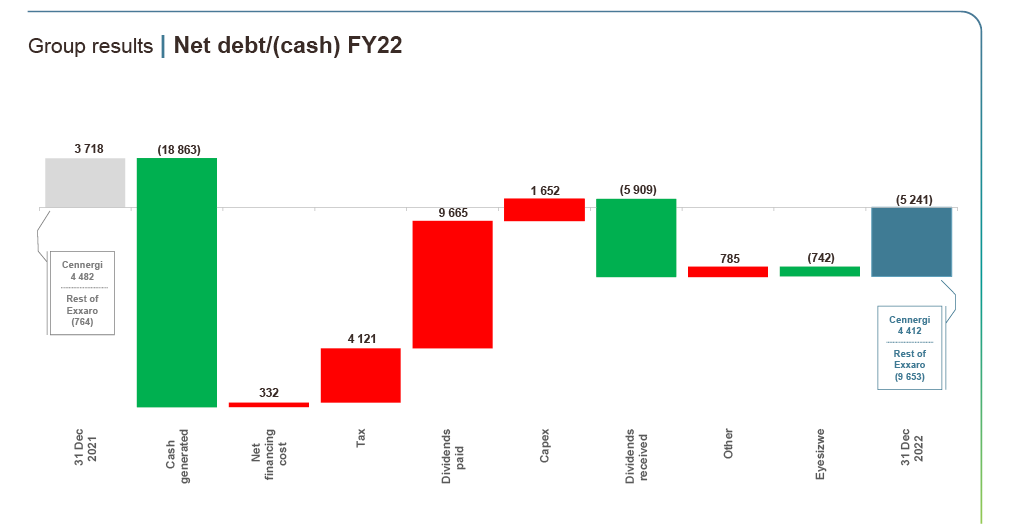
Cash flow generated by operations increased by 79% to R18 863 million (2021: R10 552 million) and, together with the dividends received from our equity-accounted investments of R5 903 million (2021: R9 991 million), were sufficient to fund capital expenditure, taxation paid and ordinary dividends paid.
Total capital expenditure decreased to R1 652 million (2021: R2 471 million), comprising R1 401 million (2021: R1 635 million) sustaining capex and R251 million (2021: R836 million) expansion capex.
Our strong cash generation resulted in a net cash position of R9 653 million (excluding Cennergi's net debt of R4 412 million), compared to a net cash position of R764 million (excluding Cennergi's net debt of R4 482 million) at 31 December 2021.
A substantial increase in gas prices, the reduction of gas supply from Russia, coupled with the implementation of a European Union embargo on Russian coal imports, contributed to the tightness of high CV coal supply sustaining the strong pricing of high CV coal through the third quarter of 2022. The low water levels in the Rhine River (Europe), high gas and coal inventories at European power utilities, as well as milder winter temperatures in October and November sent the coal prices on a downward trajectory since the start of the fourth quarter of 2022. Export tonnages continued to be negatively affected by lacklustre rail performance. This resulted in Exxaro exporting 5.2 Mt in 2022 compared to 7.6 Mt in 2021, a decrease of 32%. To mitigate rail performance, Exxaro used road transport and exported coal through alternative ports.
Domestic demand for our high CV coal was stable and we expect this segment to continue to perform well. As a result of ongoing constraints on the rail logistics, we sold export coal in the domestic market to exporters that have access to export capacity.
The average benchmark API4 RBCT export price of US$271 per tonne was 118% higher (2021: US$124 per tonne), resulting in a 161% increase in the average realised export price for Exxaro of US$251 per tonne (2021: US$96 per tonne).
Coal EBITDA of R19 023 million (FY21: R10 671 million) increased 78%, at an EBITDA margin of 42%, due to:
The increase was partly offset by:
The coal business's capex decreased by 33%, driven by 72% lower spend on expansion capital as we completed the construction of the GG6 plant. Sustaining capital decreased by 12% due to less spend at Grootegeluk and Belfast. We are starting to realise the benefit of our Capital Excellence journey, which is a combination of project savings and improved timing on project execution.
| Coal capex | 2022 Rm |
2021 Rm |
Change % |
| Sustaining | 1 374 | 1 564 | (12) |
|---|---|---|---|
| Commercial – Waterberg | 1 117 | 1 285 | (13) |
| Commercial – Mpumalanga | 252 | 261 | (3) |
| Other | 5 | 18 | (72) |
| Expansion | 231 | 836 | (72) |
| Commercial – Waterberg | 231 | 705 | (67) |
| Commercial – Mpumalanga | 131 | (100) | |
| Total coal capex | 1 605 | 2 400 | (33) |
Mafube, our 50% joint venture with Thungela, recorded equity-accounted income of R1 902 million (2021: R375 million). This significant increase is mainly due to higher export prices realised on higher sales volumes.
Cennergi generated 671 GWh of electricity in 2022 (2021: 724 GWh). The decrease in generation resulted from persistent low wind conditions in South Africa and regions such as Europe, wind farms have experienced below-normal wind conditions over the past twelve months. Our average equipment availability of 97.9% was better than contracted levels of 97.0%.
Cennergi's EBITDA margin was 80% (2021: 83%), showing the consistency of earnings underpinned by the long-term offtake agreements.
The Cennergi project financing of R4 554 million (2021: R4 700 million) will mature and be fully settled by the end of 2031. It has no recourse to the Exxaro balance sheet and is hedged through interest rate swaps at an effective rate of 12.3% (2021: 11.9%).
The 55% decrease in equity-accounted income from SIOC to R4 077 million (2021: R9 037 million), was primarily driven by an impairment charge recognised on mining assets, lower market prices and volumes as well as higher operating expenses which were partially offset by a weaker currency.
The impairment charge on mining assets was due to the production volumes being revised down in line with anticipated logistics performance.
An interim dividend of R2 498 million was received from our investment in SIOC in August 2022 (second half 2021: R6 329 million). SIOC declared a final dividend to its shareholders in February 2023. Exxaro’s share of the dividend amounts to R1 419 million, which is 43% lower than the interim dividend received. The dividend will be accounted for in the first half of 2023.
Exxaro initiated the Leeuwpan divestment process as part of its ongoing portfolio optimisation strategy to ensure the future resilience of our coal business. Progress on the divestment stalled and the process was stopped in the third quarter of 2022 to ensure stability at the mine. Exxaro will continue to review its coal assets and projects in line with its strategic goals.
Exxaro is persuing its options to dispose of its 26% shareholding in Black Mountain.
Our current B-BBEE scorecard reflects a recognition Level 3. The 2022 scorecard audit is still in progress and the certificate will be published as soon as this audit is concluded.
Our transition strategy to a clean energy and low-carbon future was presented in September 2021. We are aiming for carbon neutrality by 2050, and shorter-term goals include reducing our Scope 1 and Scope 2 carbon emissions by 43% in 2025. The strategy for Scope 3 carbon emissions reduction is still under development while we consult key stakeholders to align on objectives, impact, and outcomes. In addition, the decarbonisation plan includes climate adaptation and resilience for our operations and host communities, to minimise the impacts of physical risks associated with climate change.
Exxaro received a B score for the 2022 Climate Change (in the management band) Carbon Disclosure Project (CDP), as well as the Water Security CDP. Exxaro’s climate change CDP score is higher than the average performance for the coal mining sector (C), the Africa average (B-) and the global average
(C). Exxaro’s water security CDP score is higher than the Africa regional average (B-) and the coal mining sector average of (B-). There were no A list companies in the Coal Mining Activity Group for the water security and climate change CDPs.
The current year was characterised by some challenges, and several pleasing results and milestones. A major challenge was experienced with implementing our SLPs, due to poor capacity of local service providers. This resulted in iterations to obtain replacement contractors, resulting in delays to execute projects. Representative Stakeholder Fora are critical for efficient and effective community engagement. However, the challenge remains in achieving an acceptable structure that will fulfil all stakeholder expectations. Despite this challenge, we established a stakeholder forum at our Grootegeluk operations, and our other operations are pursuing the same.
A major milestone was the board approval of the Social Impact Strategy, which provides a “direction of travel” in terms of areas of investment (aligned to the remaining life of coal and energy generation operations in education, land use and management, and SMME development) for community upliftment and transition. The strategy is a major shift from compliance to a market-based approach and will also address skills shortages within communities, targeting women, youth, and people with disabilities.
In terms of our capital allocation framework, we will remain prudent in returning cash to shareholders, managing debt, and selectively reinvesting for the growth of our business.
The dividend policy is based on the following two components:
Exxaro continues to target a gearing ratio of below 1.5 times net debt (excluding ring-fenced project financing) to EBITDA.
The board of directors has declared a cash dividend, comprising:
Notice is hereby given that a gross final cash dividend, number 40 of 1 136 cents per share, for the year ended 31 December 2022 was declared, and is
payable to shareholders of ordinary shares.